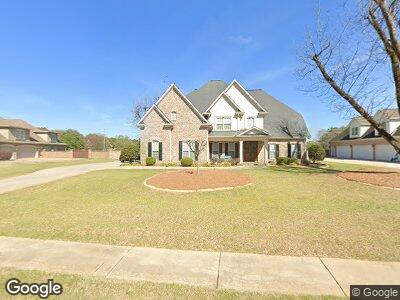
103 Running Creek Dr Warner Robins, GA 31088
Estimated Value: $589,000 - $682,000
4
Beds
4
Baths
4,109
Sq Ft
$153/Sq Ft
Est. Value
About This Home
This home is located at 103 Running Creek Dr, Warner Robins, GA 31088 and is currently estimated at $627,036, approximately $152 per square foot. 103 Running Creek Dr is a home located in Houston County with nearby schools including Lake Joy Primary School, Lake Joy Elementary School, and Feagin Mill Middle School.
Ownership History
Date
Name
Owned For
Owner Type
Purchase Details
Closed on
Jul 27, 2011
Sold by
Stroman Michael B
Bought by
Murray James H and Murray Ethel M
Current Estimated Value
Home Financials for this Owner
Home Financials are based on the most recent Mortgage that was taken out on this home.
Original Mortgage
$323,200
Interest Rate
4.53%
Mortgage Type
New Conventional
Purchase Details
Closed on
Jan 3, 2011
Sold by
Sunmark Community Bank
Bought by
Stroman Michael B
Home Financials for this Owner
Home Financials are based on the most recent Mortgage that was taken out on this home.
Original Mortgage
$326,000
Interest Rate
4.4%
Mortgage Type
Seller Take Back
Purchase Details
Closed on
Apr 7, 2009
Sold by
Sctc Development Llc
Bought by
Sunmark Community Bank
Purchase Details
Closed on
Jun 5, 2006
Sold by
Feagin Investments Llc
Bought by
Sctc Development Llc
Purchase Details
Closed on
Jan 4, 2006
Sold by
Lake Joy Development Llc
Bought by
Feagin Investments Llc
Create a Home Valuation Report for This Property
The Home Valuation Report is an in-depth analysis detailing your home's value as well as a comparison with similar homes in the area
Home Values in the Area
Average Home Value in this Area
Purchase History
| Date | Buyer | Sale Price | Title Company |
|---|---|---|---|
| Murray James H | $404,000 | None Available | |
| Stroman Michael B | $53,000 | None Available | |
| Sunmark Community Bank | $192,200 | -- | |
| Sctc Development Llc | $60,900 | -- | |
| Feagin Investments Llc | $49,500 | -- |
Source: Public Records
Mortgage History
| Date | Status | Borrower | Loan Amount |
|---|---|---|---|
| Open | Murray James H | $263,000 | |
| Closed | Murray James H | $323,200 | |
| Previous Owner | Stroman Michael B | $326,000 |
Source: Public Records
Tax History Compared to Growth
Tax History
| Year | Tax Paid | Tax Assessment Tax Assessment Total Assessment is a certain percentage of the fair market value that is determined by local assessors to be the total taxable value of land and additions on the property. | Land | Improvement |
|---|---|---|---|---|
| 2024 | $3,954 | $237,840 | $20,000 | $217,840 |
| 2023 | $3,190 | $206,720 | $20,000 | $186,720 |
| 2022 | $1,956 | $186,840 | $20,000 | $166,840 |
| 2021 | $1,537 | $167,360 | $20,000 | $147,360 |
| 2020 | $3,659 | $159,480 | $24,000 | $135,480 |
| 2019 | $3,659 | $159,480 | $24,000 | $135,480 |
| 2018 | $3,659 | $159,480 | $24,000 | $135,480 |
| 2017 | $3,662 | $159,480 | $24,000 | $135,480 |
| 2016 | $3,668 | $159,480 | $24,000 | $135,480 |
| 2015 | -- | $159,480 | $24,000 | $135,480 |
| 2014 | -- | $159,480 | $24,000 | $135,480 |
| 2013 | -- | $159,480 | $24,000 | $135,480 |
Source: Public Records
Map
Nearby Homes
- 103 Running Creek Dr
- 105 Running Creek Dr
- 19 Running Creek Dr
- 17 Running Creek Dr
- 15 Running Creek Dr
- 101 Running Creek Dr
- 102 Running Creek Dr
- 16 Running Creek Dr
- 18 Running Creek Dr
- 14 Running Creek Dr
- 201 Old Bridge Rd
- 101 Bridgeway Dr
- 203 Old Bridge Rd
- 109 Running Creek Dr
- 104 Running Creek Dr
- 1326 Feagin Mill Rd
- 200 Old Bridge Rd
- 810 Lake Joy Rd
- 205 Old Bridge Rd
- 111 Running Creek Dr