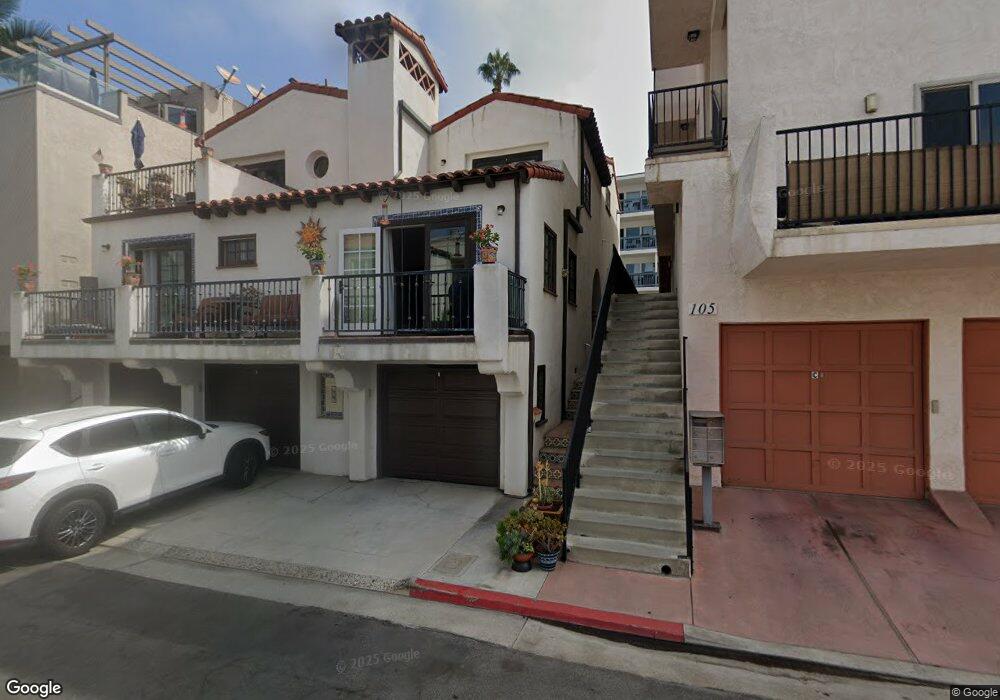
103 S Alameda Ln Unit B San Clemente, CA 92672
Central San Clemente NeighborhoodEstimated Value: $1,489,000 - $1,809,000
3
Beds
3
Baths
1,625
Sq Ft
$1,035/Sq Ft
Est. Value
About This Home
This home is located at 103 S Alameda Ln Unit B, San Clemente, CA 92672 and is currently estimated at $1,681,793, approximately $1,034 per square foot. 103 S Alameda Ln Unit B is a home located in Orange County with nearby schools including Clarence Lobo Elementary School, Shorecliffs Middle School, and San Clemente High School.
Ownership History
Date
Name
Owned For
Owner Type
Purchase Details
Closed on
Aug 9, 2010
Sold by
Fromm Lawrence and Fromm Jeanette M
Bought by
Fromm Dr Stuart Lawrence and Fromm Jeannette Marie
Current Estimated Value
Purchase Details
Closed on
Mar 23, 2010
Sold by
Jp Morgan Chase Bank National Associatio
Bought by
Fromm Lawrence and Fromm Jeannette M
Purchase Details
Closed on
Aug 13, 2009
Sold by
Wolf Anna G
Bought by
Jpmorgan Chase Bank National Association
Purchase Details
Closed on
Jan 11, 2005
Sold by
Gomez Rogelio Rivera
Bought by
Wolf Anna G
Purchase Details
Closed on
Mar 14, 1995
Sold by
Yeilding Dan W
Bought by
Wolf Anna G
Home Financials for this Owner
Home Financials are based on the most recent Mortgage that was taken out on this home.
Original Mortgage
$250,000
Interest Rate
8.9%
Mortgage Type
Purchase Money Mortgage
Create a Home Valuation Report for This Property
The Home Valuation Report is an in-depth analysis detailing your home's value as well as a comparison with similar homes in the area
Home Values in the Area
Average Home Value in this Area
Purchase History
| Date | Buyer | Sale Price | Title Company |
|---|---|---|---|
| Fromm Dr Stuart Lawrence | -- | None Available | |
| Fromm Lawrence | $735,000 | Lsi Title Company Ca | |
| Jpmorgan Chase Bank National Association | $637,500 | None Available | |
| Wolf Anna G | -- | Stewart Title Of California | |
| Wolf Anna G | $330,000 | Commonwealth Land Title Co |
Source: Public Records
Mortgage History
| Date | Status | Borrower | Loan Amount |
|---|---|---|---|
| Previous Owner | Wolf Anna G | $250,000 |
Source: Public Records
Tax History Compared to Growth
Tax History
| Year | Tax Paid | Tax Assessment Tax Assessment Total Assessment is a certain percentage of the fair market value that is determined by local assessors to be the total taxable value of land and additions on the property. | Land | Improvement |
|---|---|---|---|---|
| 2025 | $9,426 | $948,747 | $629,851 | $318,896 |
| 2024 | $9,426 | $930,145 | $617,501 | $312,644 |
| 2023 | $9,226 | $911,907 | $605,393 | $306,514 |
| 2022 | $9,051 | $894,027 | $593,523 | $300,504 |
| 2021 | $8,876 | $876,498 | $581,886 | $294,612 |
| 2020 | $8,788 | $867,511 | $575,919 | $291,592 |
| 2019 | $8,615 | $850,501 | $564,626 | $285,875 |
| 2018 | $8,450 | $833,825 | $553,555 | $280,270 |
| 2017 | $8,285 | $817,476 | $542,701 | $274,775 |
| 2016 | $8,126 | $801,448 | $532,060 | $269,388 |
| 2015 | $8,004 | $789,410 | $524,068 | $265,342 |
| 2014 | $7,851 | $773,947 | $513,802 | $260,145 |
Source: Public Records
Map
Nearby Homes
- 420 Monterey Ln Unit R16
- 117 Santa Ana Ln Unit A
- 405 Avenida Granada Unit 212
- 405 Avenida Granada Unit 202
- 501 Elena Ln Unit B
- 423 Avenida Granada Unit 54
- 217 Vista Marina
- 306 Avenida Cabrillo
- 309 W Avenida Palizada
- 251 Avenida Del Mar
- 412 Arenoso Ln Unit 104
- 256 Avenida Madrid
- 251 Avenida Madrid
- 255 W Marquita Unit 1
- 243 Avenida Madrid
- 147 Trafalgar Ln
- 227 Avenida Serra
- 229 Avenida Monterey Unit B
- 229 Avenida Monterey Unit A
- 144 Esplanade
- 103 S Alameda Ln Unit A
- 515 Avenida Del Mar
- 105 S Alameda Ln Unit A
- 105 S Alameda Ln Unit C
- 105 S Alameda Ln
- 107 S Alameda Ln Unit A
- 107 S Alameda Ln Unit B
- 107 S Alameda Ln Unit C
- 107 S Alameda Ln
- 106 Capistrano Ln
- 106 Capistrano Ln Unit 3
- 109 S Alameda Ln Unit A
- 109 S Alameda Ln Unit 1
- 109 S Alameda Ln
- 511 Avenida Del Mar
- 511 Avenida Del Mar Unit 4
- 511 Avenida Del Mar Unit A
- 511 Avenida Del Mar Unit B
- 511 Avenida Del Mar Unit D
- 511 Avenida Del Mar Unit 1