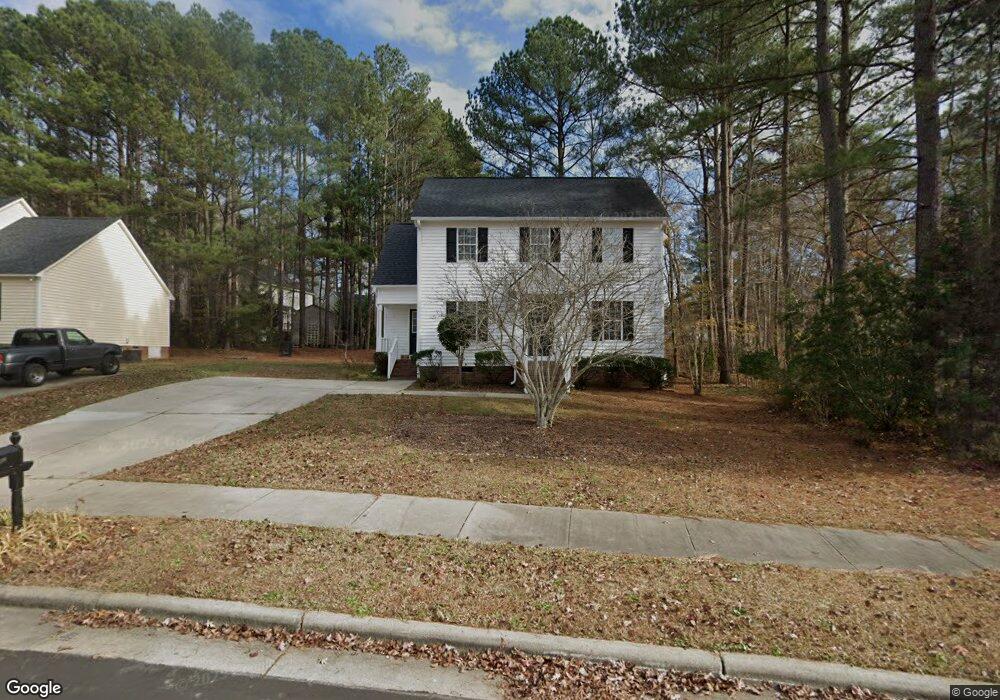
103 Saint Johns St Knightdale, NC 27545
Estimated Value: $325,000 - $343,000
3
Beds
3
Baths
1,470
Sq Ft
$226/Sq Ft
Est. Value
About This Home
This home is located at 103 Saint Johns St, Knightdale, NC 27545 and is currently estimated at $332,224, approximately $226 per square foot. 103 Saint Johns St is a home located in Wake County with nearby schools including Knightdale Elementary School, Neuse River Middle School, and Knightdale High.
Ownership History
Date
Name
Owned For
Owner Type
Purchase Details
Closed on
May 18, 2022
Sold by
Sfr Xii Charlotte Owner 1 Lp
Bought by
Sfr Xii Nm Releigh Owner 1 Lp
Current Estimated Value
Purchase Details
Closed on
Sep 23, 2021
Sold by
Opendoor Property C Llc
Bought by
Sfr Xii Charlotte Owner 1 Lp
Purchase Details
Closed on
Aug 12, 2021
Sold by
Walker Stanley and Walker Pershell
Bought by
Opendoor Property C Llc
Purchase Details
Closed on
Aug 2, 2021
Sold by
Walker Stanley and Walker Pershell
Bought by
Opendoor Property C Llc
Purchase Details
Closed on
Apr 30, 2001
Sold by
Spectrum Homes Inc
Bought by
Walker Stanley and Walker Pershell
Home Financials for this Owner
Home Financials are based on the most recent Mortgage that was taken out on this home.
Original Mortgage
$133,824
Interest Rate
6.98%
Mortgage Type
VA
Create a Home Valuation Report for This Property
The Home Valuation Report is an in-depth analysis detailing your home's value as well as a comparison with similar homes in the area
Home Values in the Area
Average Home Value in this Area
Purchase History
| Date | Buyer | Sale Price | Title Company |
|---|---|---|---|
| Sfr Xii Nm Releigh Owner 1 Lp | -- | None Listed On Document | |
| Sfr Xii Charlotte Owner 1 Lp | $310,500 | None Available | |
| Opendoor Property C Llc | $300,500 | None Available | |
| Opendoor Property C Llc | $300,500 | None Listed On Document | |
| Walker Stanley | $131,500 | -- |
Source: Public Records
Mortgage History
| Date | Status | Borrower | Loan Amount |
|---|---|---|---|
| Previous Owner | Walker Stanley | $133,824 |
Source: Public Records
Tax History Compared to Growth
Tax History
| Year | Tax Paid | Tax Assessment Tax Assessment Total Assessment is a certain percentage of the fair market value that is determined by local assessors to be the total taxable value of land and additions on the property. | Land | Improvement |
|---|---|---|---|---|
| 2025 | $2,988 | $310,126 | $85,000 | $225,126 |
| 2024 | $2,977 | $310,126 | $85,000 | $225,126 |
| 2023 | $2,097 | $187,587 | $38,000 | $149,587 |
| 2022 | $2,026 | $187,587 | $38,000 | $149,587 |
| 2021 | $1,933 | $187,587 | $38,000 | $149,587 |
| 2020 | $1,933 | $187,587 | $38,000 | $149,587 |
| 2019 | $1,708 | $146,707 | $38,000 | $108,707 |
| 2018 | $1,611 | $146,707 | $38,000 | $108,707 |
| 2017 | $1,553 | $146,707 | $38,000 | $108,707 |
| 2016 | $1,532 | $146,707 | $38,000 | $108,707 |
| 2015 | $1,553 | $146,730 | $37,000 | $109,730 |
| 2014 | -- | $146,730 | $37,000 | $109,730 |
Source: Public Records
Map
Nearby Homes
- 104 Saint Johns St
- 216 Walbury Dr
- 413 Laurens Way
- 302 Brakeman St
- 619 Laurens Way
- 117 Stanway Dr
- 506 Sternwheel Way
- 102 Switchback St
- 1442 Jay Rd
- 1452 Jay Rd
- 1500 Wader Cir
- 1456 Jay Rd
- 1516 Wader Cir
- 1463 Jay Rd
- 1448 Jay Rd
- 1700 Goldfinch Perch Ln
- 1580 Goldfinch Perch Ln
- 444 Haywood Glen Dr
- 1512 Wader Cir
- 1466 Jay Rd
- 103 St Johns St
- 101 Saint Johns St
- 707 Southampton Dr
- 801 Southampton Dr
- 102 Saint Johns St
- 705 Southampton Dr
- 104 St Johns St
- 803 Southampton Dr
- 107 St Johns St
- 107 Saint Johns St
- 2002 Gallows Way
- 805 Southampton Dr
- 2004 Gallows Way
- 706 Southampton Dr
- 2006 Gallows Way
- 2008 Gallows Way
- 2010 Gallows Way
- 704 Southampton Dr
- 702 Southampton Dr
- 110 Saint Johns St