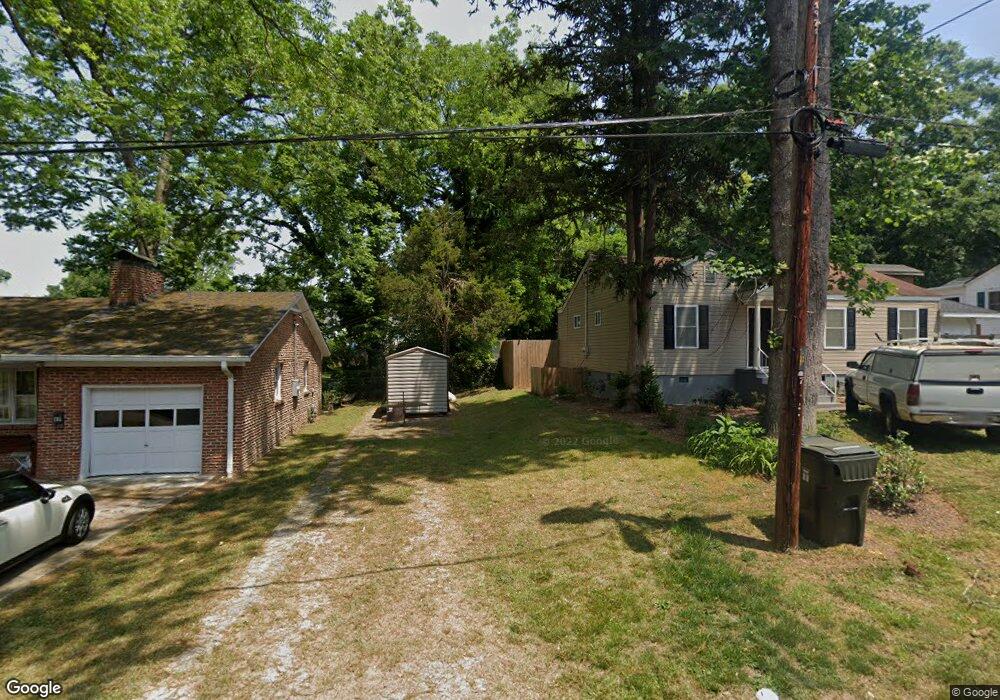
103 Schaefer Ct Unit AB Toccoa, GA 30577
Estimated Value: $142,005 - $219,000
3
Beds
2
Baths
1,201
Sq Ft
$150/Sq Ft
Est. Value
About This Home
This home is located at 103 Schaefer Ct Unit AB, Toccoa, GA 30577 and is currently estimated at $180,501, approximately $150 per square foot. 103 Schaefer Ct Unit AB is a home located in Stephens County with nearby schools including Stephens County High School.
Ownership History
Date
Name
Owned For
Owner Type
Purchase Details
Closed on
Jul 17, 2019
Sold by
Dinh Hai Quang
Bought by
Palacios Properties Llc
Current Estimated Value
Home Financials for this Owner
Home Financials are based on the most recent Mortgage that was taken out on this home.
Original Mortgage
$57,000
Interest Rate
4.1%
Mortgage Type
New Conventional
Purchase Details
Closed on
Jun 3, 2019
Sold by
Bowen Properties Llc
Bought by
Dinh Hai Quang and Covarrubias Maria Brenda
Home Financials for this Owner
Home Financials are based on the most recent Mortgage that was taken out on this home.
Original Mortgage
$57,000
Interest Rate
4.1%
Mortgage Type
New Conventional
Purchase Details
Closed on
Apr 13, 2010
Sold by
Scott Rocky Allen
Bought by
Lbd Enterprises Llc
Purchase Details
Closed on
Dec 23, 2002
Bought by
<Buyer Info Not Present>
Create a Home Valuation Report for This Property
The Home Valuation Report is an in-depth analysis detailing your home's value as well as a comparison with similar homes in the area
Purchase History
| Date | Buyer | Sale Price | Title Company |
|---|---|---|---|
| Palacios Properties Llc | -- | -- | |
| Dinh Hai Quang | $62,000 | -- | |
| Lbd Enterprises Llc | $53,000 | -- | |
| <Buyer Info Not Present> | $35,000 | -- |
Source: Public Records
Mortgage History
| Date | Status | Borrower | Loan Amount |
|---|---|---|---|
| Closed | Dinh Hai Quang | $57,000 |
Source: Public Records
Tax History
| Year | Tax Paid | Tax Assessment Tax Assessment Total Assessment is a certain percentage of the fair market value that is determined by local assessors to be the total taxable value of land and additions on the property. | Land | Improvement |
|---|---|---|---|---|
| 2025 | $1,488 | $42,652 | $1,134 | $41,518 |
| 2024 | $986 | $27,658 | $1,134 | $26,524 |
| 2023 | $905 | $25,600 | $1,134 | $24,466 |
| 2022 | $718 | $24,111 | $1,134 | $22,977 |
| 2021 | $683 | $21,835 | $1,134 | $20,701 |
| 2020 | $700 | $22,173 | $1,134 | $21,039 |
| 2019 | $703 | $22,159 | $1,134 | $21,025 |
| 2018 | $703 | $22,159 | $1,134 | $21,025 |
| 2017 | $714 | $22,159 | $1,134 | $21,025 |
| 2016 | $703 | $22,158 | $1,134 | $21,024 |
| 2015 | $732 | $22,042 | $1,134 | $20,908 |
| 2014 | -- | $22,042 | $1,134 | $20,908 |
| 2013 | -- | $22,214 | $1,134 | $21,080 |
Source: Public Records
Map
Nearby Homes
- 109 Schaefer Ct
- 239 E Doyle St
- 259 E Currahee St
- 100 Forest Ave
- 22 Green Hill Place
- 157 Taylor St
- 53 Cole Manor Dr
- 84 Oak Creek Cir
- 30 Moore Ave
- 320 S Pond St
- 288 Davis Ave
- 345 Prather Bridge Rd
- 614 616 S Pond St
- 128 Branch St
- 1168 Rosedale St
- 478 S Pond St
- 500 S Pond St
- 288 S Broad St
- 45 Hayes St
- 91 Remsdale St
- 89 Schaefer Ct
- 115 Schaefer Ct
- 39 Schaefer Ct
- 80 Schaefer Ct
- 117 Schaefer Ct
- 107 Schaefer Ct
- 118 Schaefer Ct
- 104 Schaefer Ct
- 54 Schaefer Ct
- 54 Schaefer Ct Unit 19,20
- 194 E Doyle St
- 186 E Doyle St
- 214 E Doyle St
- 414 Doyle St E
- 18 Schaefer Ct
- 216 Walnut St
- 200 Walnut St
- 242 Walnut St
- 240 E Doyle St
- 264 Railroad St
Your Personal Tour Guide
Ask me questions while you tour the home.