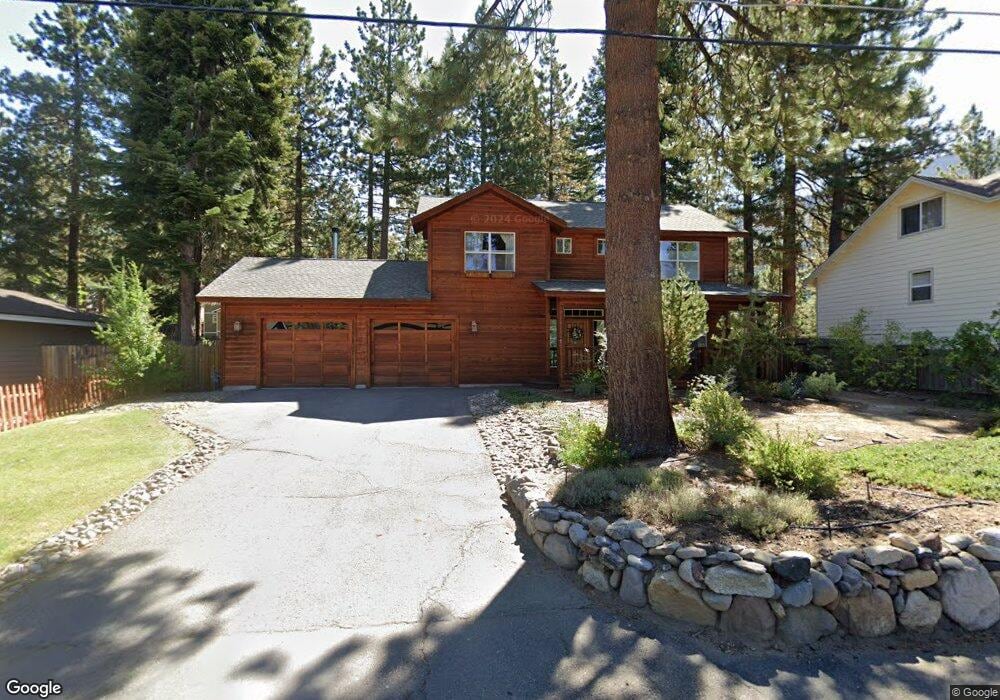
103 Sequoia Dr Stateline, NV 89449
Estimated Value: $1,561,839 - $1,965,000
--
Bed
--
Bath
3,018
Sq Ft
$584/Sq Ft
Est. Value
About This Home
This home is located at 103 Sequoia Dr, Stateline, NV 89449 and is currently estimated at $1,763,960, approximately $584 per square foot. 103 Sequoia Dr is a home with nearby schools including Zephyr Cove Elementary School, George Whittell High School, and Douglas County High School.
Ownership History
Date
Name
Owned For
Owner Type
Purchase Details
Closed on
Apr 9, 2021
Sold by
Adler Joshua and Adler Elvia
Bought by
Joshua And Elvia Adler Living Trust and Adler
Current Estimated Value
Home Financials for this Owner
Home Financials are based on the most recent Mortgage that was taken out on this home.
Original Mortgage
$446,900
Outstanding Balance
$403,497
Interest Rate
3%
Mortgage Type
New Conventional
Estimated Equity
$1,360,463
Purchase Details
Closed on
Apr 23, 2018
Sold by
Adler Joshua H and Adler Elvia
Bought by
Adler Joshua Haym and Adler Elvia
Purchase Details
Closed on
Feb 25, 2016
Sold by
Adler Joshua and Adler Elvia
Bought by
Adler Joshua H and Adler Elvia
Home Financials for this Owner
Home Financials are based on the most recent Mortgage that was taken out on this home.
Original Mortgage
$500,000
Interest Rate
2.75%
Mortgage Type
Adjustable Rate Mortgage/ARM
Create a Home Valuation Report for This Property
The Home Valuation Report is an in-depth analysis detailing your home's value as well as a comparison with similar homes in the area
Home Values in the Area
Average Home Value in this Area
Purchase History
| Date | Buyer | Sale Price | Title Company |
|---|---|---|---|
| Joshua And Elvia Adler Living Trust | -- | Stewart Title | |
| Adler Joshua | -- | Stewart Title Company | |
| Adler Joshua Haym | -- | None Available | |
| Adler Joshua H | -- | Western Title Co |
Source: Public Records
Mortgage History
| Date | Status | Borrower | Loan Amount |
|---|---|---|---|
| Open | Adler Joshua | $446,900 | |
| Previous Owner | Adler Joshua H | $500,000 |
Source: Public Records
Tax History Compared to Growth
Tax History
| Year | Tax Paid | Tax Assessment Tax Assessment Total Assessment is a certain percentage of the fair market value that is determined by local assessors to be the total taxable value of land and additions on the property. | Land | Improvement |
|---|---|---|---|---|
| 2025 | $4,316 | $187,293 | $63,000 | $124,293 |
| 2024 | $4,316 | $188,497 | $63,000 | $125,497 |
| 2023 | $4,063 | $178,688 | $63,000 | $115,688 |
| 2022 | $4,063 | $165,457 | $57,750 | $107,707 |
| 2021 | $3,943 | $156,992 | $54,250 | $102,742 |
| 2020 | $3,828 | $155,198 | $54,250 | $100,948 |
| 2019 | $3,720 | $157,900 | $58,450 | $99,450 |
| 2018 | $3,611 | $152,857 | $56,000 | $96,857 |
| 2017 | $3,509 | $153,129 | $56,000 | $97,129 |
| 2016 | $3,423 | $154,777 | $56,000 | $98,777 |
| 2015 | $3,416 | $154,777 | $56,000 | $98,777 |
| 2014 | $3,315 | $148,265 | $56,000 | $92,265 |
Source: Public Records
Map
Nearby Homes
- 139 Rosewood Cir
- 150 Woodland Way
- 169 Crescent Dr Unit 53
- 192 Pine Ridge Dr
- 171 Pine Dr
- 190 Meadow Ln
- 174 Hall Ct
- 173 Hall Ct
- Zephyr Duet Plan at Sierra Colina
- 157 Sierra Colina Dr
- 157 Sierra Colina Dr Unit 9
- 148 Sierra Colina Dr
- 121 Sierra Colina Dr Unit 21
- 121 Sierra Colina Dr
- 127 Sierra Colina Dr
- 127 Sierra Colina Dr Unit 19
- 160 Sierra Colina Dr
- 396 Sherwood Dr
- 421 Edgewood Dr
- 46 Chalet
- 107 Sequoia Dr
- 101 Sequoia Dr
- 100 Daggett Way
- 104 Daggett Way
- 104 Daggett Way
- 108 Sequoia
- 108 Daggett Way
- 111 Sequoia Dr
- 110 Sequoia Dr
- 110 Daggett Way
- 187 W St
- 187 W St Unit 1
- 112 Sequoia Dr
- 113 Sequoia Dr
- 104 Hawthorne Way
- 114 Sequoia Dr
- 103 Daggett Way
- 108 Hawthorne Way
- 111 Daggett Way
- 100 Hawthorne Way