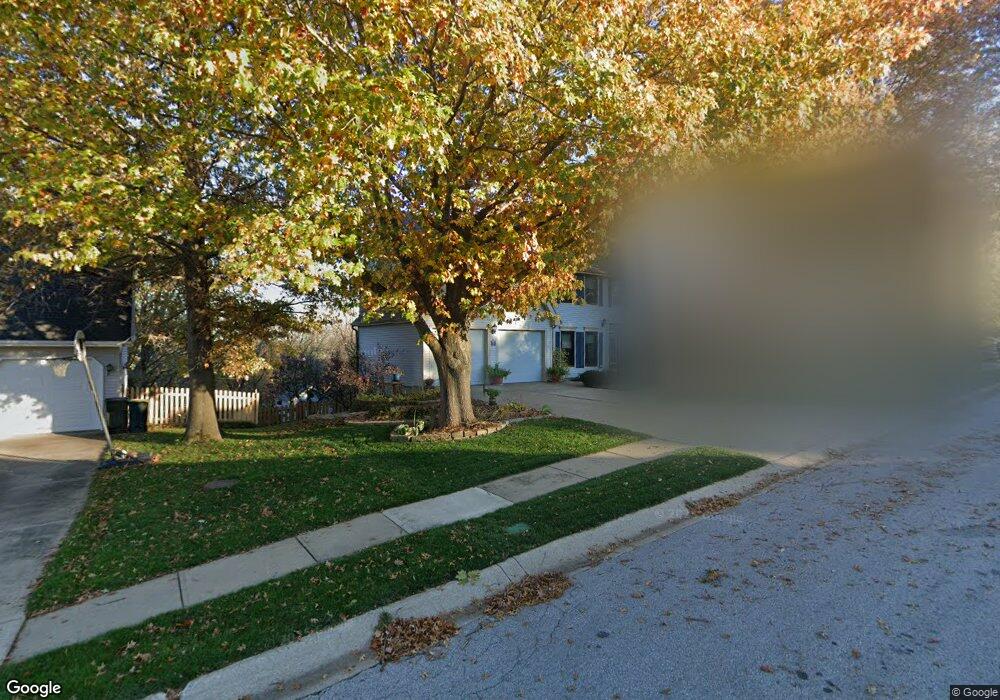
103 Southfork Rd Lansing, KS 66043
Estimated Value: $426,000 - $477,000
4
Beds
4
Baths
3,225
Sq Ft
$141/Sq Ft
Est. Value
About This Home
This home is located at 103 Southfork Rd, Lansing, KS 66043 and is currently estimated at $456,005, approximately $141 per square foot. 103 Southfork Rd is a home located in Leavenworth County with nearby schools including Lansing Elementary School, Lansing Middle 6-8, and Lansing High 9-12.
Ownership History
Date
Name
Owned For
Owner Type
Purchase Details
Closed on
Oct 1, 1989
Bought by
Egger Bradley G and Egger Elizabeth A
Current Estimated Value
Home Financials for this Owner
Home Financials are based on the most recent Mortgage that was taken out on this home.
Original Mortgage
$50,000
Outstanding Balance
$37,388
Interest Rate
10.16%
Mortgage Type
New Conventional
Estimated Equity
$418,617
Create a Home Valuation Report for This Property
The Home Valuation Report is an in-depth analysis detailing your home's value as well as a comparison with similar homes in the area
Home Values in the Area
Average Home Value in this Area
Purchase History
| Date | Buyer | Sale Price | Title Company |
|---|---|---|---|
| Egger Bradley G | $186,400 | -- |
Source: Public Records
Mortgage History
| Date | Status | Borrower | Loan Amount |
|---|---|---|---|
| Open | Egger Bradley G | $50,000 | |
| Closed | Egger Bradley G | $168,585 |
Source: Public Records
Tax History Compared to Growth
Tax History
| Year | Tax Paid | Tax Assessment Tax Assessment Total Assessment is a certain percentage of the fair market value that is determined by local assessors to be the total taxable value of land and additions on the property. | Land | Improvement |
|---|---|---|---|---|
| 2025 | $6,574 | $50,423 | $7,089 | $43,334 |
| 2024 | $6,155 | $48,484 | $7,089 | $41,395 |
| 2023 | $6,155 | $47,160 | $7,089 | $40,071 |
| 2022 | $5,918 | $42,872 | $5,667 | $37,205 |
| 2021 | $5,942 | $41,147 | $5,667 | $35,480 |
| 2020 | $5,621 | $38,318 | $5,667 | $32,651 |
| 2019 | $5,321 | $36,236 | $5,667 | $30,569 |
| 2018 | $5,318 | $36,236 | $5,667 | $30,569 |
| 2017 | $5,211 | $35,431 | $5,667 | $29,764 |
| 2016 | $5,213 | $35,431 | $5,667 | $29,764 |
| 2015 | $5,198 | $35,431 | $5,667 | $29,764 |
| 2014 | $5,040 | $35,075 | $5,667 | $29,408 |
Source: Public Records
Map
Nearby Homes
- 866 Clearview Dr
- 875 Clearview Dr
- 922 Southfork St
- 1322 Rock Creek Ct
- 833 Rock Creek Dr
- 1221 S Desoto Rd
- 811 4-H Rd
- 000 4-H Rd
- 527 S Valley Dr
- 104 Olive St
- 24431 139th St
- 13965 Mc Intyre Rd
- 13788 McIntyre1 Rd
- 13788 Mcintyre Rd
- 13788 McIntyre2 Rd
- 522 Forestglen Ln
- 202 S Main St
- 124 S Main St
- 546 Hithergreen Dr
- 218 E Kay St
- 101 Southfork Rd
- 105 Southfork Rd
- 107 Southfork Rd
- 102 Southfork Rd
- 104 Southfork Rd
- 100 Southfork Rd
- 106 Southfork Rd
- 109 Southfork Rd
- 108 Southfork Rd
- 110 Southfork Rd
- 1208 Joshua Ct
- 1205 Joshua Ct
- 111 Southfork Rd
- 130 Willow Dr
- 112 Southfork Rd
- 110 Willow Point Rd
- 109 Willow Point Rd
- 128 Willow Dr
- 1203 Joshua Ct
- 1206 Joshua Ct