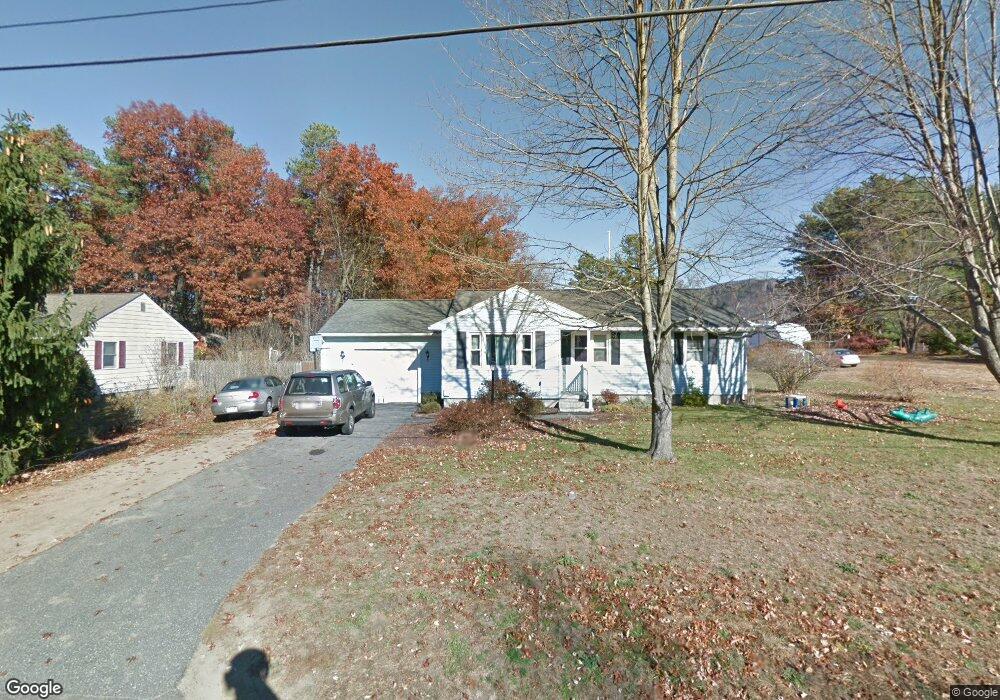
103 Strong St Easthampton, MA 01027
Estimated Value: $351,306 - $385,000
3
Beds
2
Baths
1,084
Sq Ft
$335/Sq Ft
Est. Value
About This Home
This home is located at 103 Strong St, Easthampton, MA 01027 and is currently estimated at $363,077, approximately $334 per square foot. 103 Strong St is a home located in Hampshire County with nearby schools including Easthampton High School, Hilltown Cooperative Charter Public School, and Calvary Baptist Christian School.
Ownership History
Date
Name
Owned For
Owner Type
Purchase Details
Closed on
May 19, 2020
Sold by
Taylor Carol A and Strycharz Joan C
Bought by
Aquino Gabriel and Smith Tamara L
Current Estimated Value
Home Financials for this Owner
Home Financials are based on the most recent Mortgage that was taken out on this home.
Original Mortgage
$235,290
Outstanding Balance
$208,500
Interest Rate
3.3%
Mortgage Type
VA
Estimated Equity
$154,577
Create a Home Valuation Report for This Property
The Home Valuation Report is an in-depth analysis detailing your home's value as well as a comparison with similar homes in the area
Home Values in the Area
Average Home Value in this Area
Purchase History
| Date | Buyer | Sale Price | Title Company |
|---|---|---|---|
| Aquino Gabriel | $230,000 | None Available |
Source: Public Records
Mortgage History
| Date | Status | Borrower | Loan Amount |
|---|---|---|---|
| Open | Aquino Gabriel | $235,290 |
Source: Public Records
Tax History Compared to Growth
Tax History
| Year | Tax Paid | Tax Assessment Tax Assessment Total Assessment is a certain percentage of the fair market value that is determined by local assessors to be the total taxable value of land and additions on the property. | Land | Improvement |
|---|---|---|---|---|
| 2025 | $3,921 | $286,800 | $111,000 | $175,800 |
| 2024 | $3,786 | $279,200 | $107,900 | $171,300 |
| 2023 | $2,883 | $196,800 | $84,900 | $111,900 |
| 2022 | $3,253 | $196,800 | $84,900 | $111,900 |
| 2021 | $3,721 | $202,500 | $84,900 | $117,600 |
| 2020 | $3,495 | $196,800 | $84,900 | $111,900 |
| 2019 | $2,928 | $189,400 | $84,900 | $104,500 |
| 2018 | $2,811 | $175,700 | $80,400 | $95,300 |
| 2017 | $2,743 | $169,200 | $77,300 | $91,900 |
| 2016 | $2,842 | $182,300 | $77,300 | $105,000 |
| 2015 | $2,762 | $182,300 | $77,300 | $105,000 |
Source: Public Records
Map
Nearby Homes