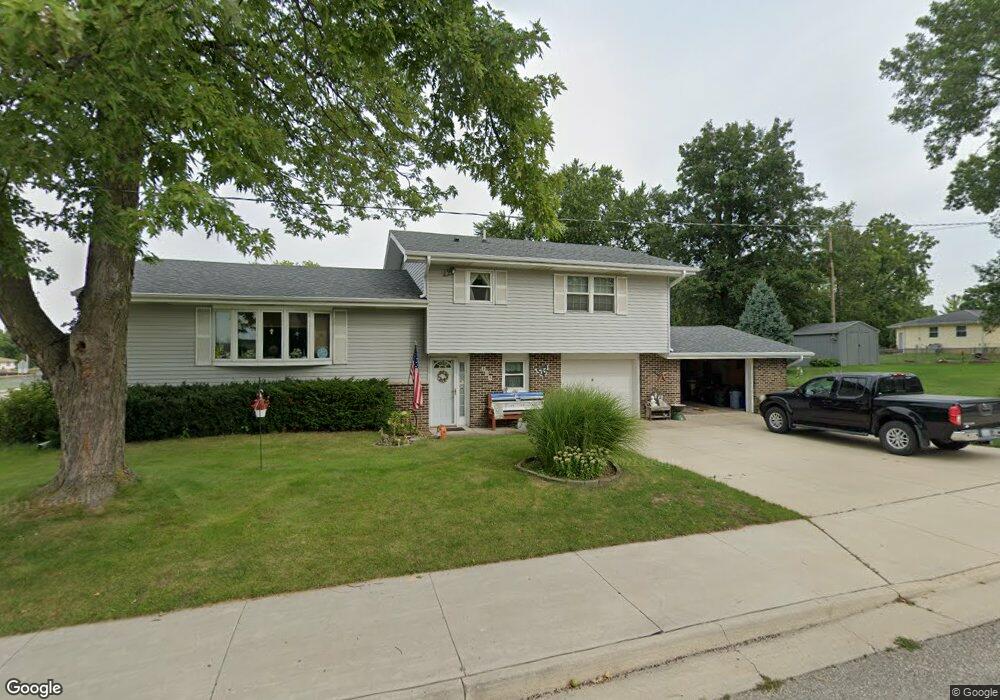
103 Trader St Center Point, IA 52213
Estimated Value: $196,000 - $271,000
3
Beds
3
Baths
1,378
Sq Ft
$165/Sq Ft
Est. Value
About This Home
This home is located at 103 Trader St, Center Point, IA 52213 and is currently estimated at $227,921, approximately $165 per square foot. 103 Trader St is a home located in Linn County with nearby schools including Center Point-Urbana Primary School, Center Point-Urbana Intermediate School, and Center Point-Urbana Middle School.
Ownership History
Date
Name
Owned For
Owner Type
Purchase Details
Closed on
Apr 28, 2005
Sold by
Sholes Jon F and Sholes Donna J
Bought by
Aarhus Collin V and Aarhus Barbara A
Current Estimated Value
Home Financials for this Owner
Home Financials are based on the most recent Mortgage that was taken out on this home.
Original Mortgage
$30,500
Outstanding Balance
$15,678
Interest Rate
5.62%
Mortgage Type
Fannie Mae Freddie Mac
Estimated Equity
$212,243
Create a Home Valuation Report for This Property
The Home Valuation Report is an in-depth analysis detailing your home's value as well as a comparison with similar homes in the area
Home Values in the Area
Average Home Value in this Area
Purchase History
| Date | Buyer | Sale Price | Title Company |
|---|---|---|---|
| Aarhus Collin V | $150,000 | -- |
Source: Public Records
Mortgage History
| Date | Status | Borrower | Loan Amount |
|---|---|---|---|
| Open | Aarhus Collin V | $30,500 | |
| Closed | Aarhus Collin V | $105,000 |
Source: Public Records
Tax History Compared to Growth
Tax History
| Year | Tax Paid | Tax Assessment Tax Assessment Total Assessment is a certain percentage of the fair market value that is determined by local assessors to be the total taxable value of land and additions on the property. | Land | Improvement |
|---|---|---|---|---|
| 2025 | $4,246 | $269,600 | $16,800 | $252,800 |
| 2024 | $4,136 | $259,800 | $16,800 | $243,000 |
| 2023 | $4,136 | $259,800 | $16,800 | $243,000 |
| 2022 | $4,126 | $204,400 | $16,800 | $187,600 |
| 2021 | $3,792 | $204,400 | $16,800 | $187,600 |
| 2020 | $3,792 | $179,400 | $16,800 | $162,600 |
| 2019 | $3,376 | $164,900 | $16,800 | $148,100 |
| 2018 | $3,294 | $164,900 | $16,800 | $148,100 |
| 2017 | $3,226 | $157,100 | $16,800 | $140,300 |
| 2016 | $3,295 | $157,100 | $16,800 | $140,300 |
| 2015 | $3,299 | $157,100 | $16,800 | $140,300 |
| 2014 | $3,112 | $157,100 | $16,800 | $140,300 |
| 2013 | $3,086 | $157,100 | $16,800 | $140,300 |
Source: Public Records
Map
Nearby Homes