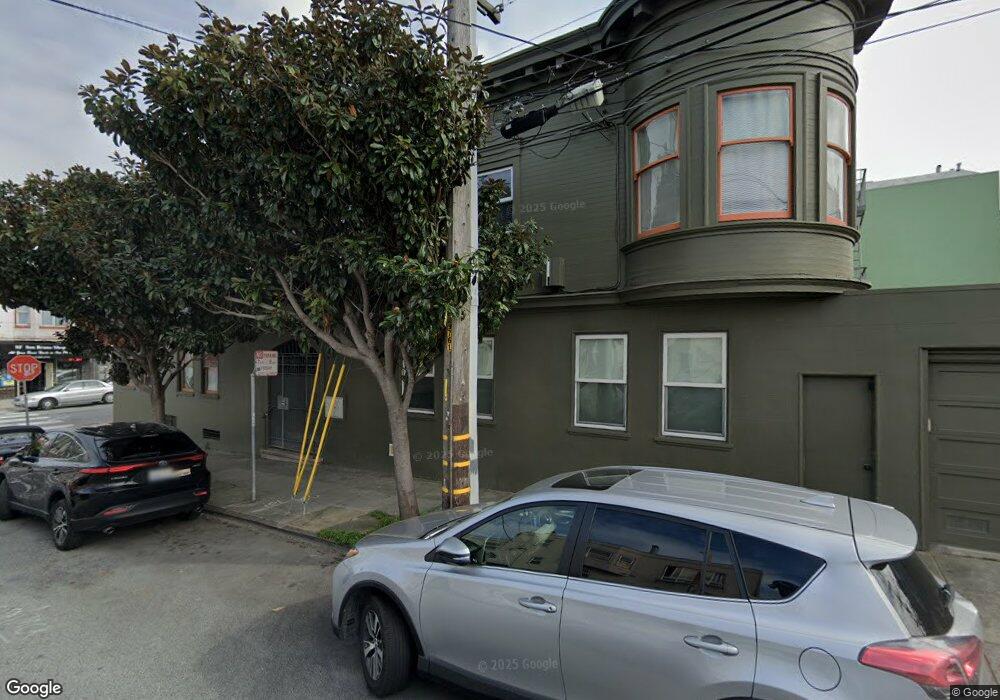
103 Woolsey St Unit 109 San Francisco, CA 94134
Portola NeighborhoodEstimated Value: $1,254,000 - $1,643,000
6
Beds
4
Baths
4,000
Sq Ft
$345/Sq Ft
Est. Value
About This Home
This home is located at 103 Woolsey St Unit 109, San Francisco, CA 94134 and is currently estimated at $1,379,620, approximately $344 per square foot. 103 Woolsey St Unit 109 is a home located in San Francisco County with nearby schools including Edward R. Taylor Elementary, King Jr. (Martin Luther) Academic Middle School, and KIPP Bayview Academy.
Ownership History
Date
Name
Owned For
Owner Type
Purchase Details
Closed on
Jun 26, 2013
Sold by
Digital Display Innovations Llc
Bought by
Jn5282013 Llc
Current Estimated Value
Home Financials for this Owner
Home Financials are based on the most recent Mortgage that was taken out on this home.
Original Mortgage
$588,000
Interest Rate
3.38%
Mortgage Type
Commercial
Purchase Details
Closed on
Jun 19, 2013
Sold by
Lucey Family Llc
Bought by
Schrader John and Krstovich Nyra
Home Financials for this Owner
Home Financials are based on the most recent Mortgage that was taken out on this home.
Original Mortgage
$588,000
Interest Rate
3.38%
Mortgage Type
Commercial
Purchase Details
Closed on
Jul 16, 2003
Sold by
Sullivan Mary Kate and Lucey James
Bought by
Lucey Family Llc
Purchase Details
Closed on
Sep 16, 1997
Sold by
Lucey and Julia
Bought by
Lucey James and Lucey Julia A
Create a Home Valuation Report for This Property
The Home Valuation Report is an in-depth analysis detailing your home's value as well as a comparison with similar homes in the area
Home Values in the Area
Average Home Value in this Area
Purchase History
| Date | Buyer | Sale Price | Title Company |
|---|---|---|---|
| Jn5282013 Llc | -- | None Available | |
| Digital Display Innovations Llc | -- | None Available | |
| Margulis Neal | -- | None Available | |
| Krstovich Nyra | -- | None Available | |
| Schrader John | $840,000 | Fidelity National Title Co | |
| Lucey Family Llc | -- | -- | |
| Sullivan Mary Kate | -- | -- | |
| Lucey James | -- | -- |
Source: Public Records
Mortgage History
| Date | Status | Borrower | Loan Amount |
|---|---|---|---|
| Previous Owner | Schrader John | $588,000 |
Source: Public Records
Tax History Compared to Growth
Tax History
| Year | Tax Paid | Tax Assessment Tax Assessment Total Assessment is a certain percentage of the fair market value that is determined by local assessors to be the total taxable value of land and additions on the property. | Land | Improvement |
|---|---|---|---|---|
| 2025 | $13,225 | $1,034,387 | $724,074 | $310,313 |
| 2024 | $13,225 | $1,014,106 | $709,877 | $304,229 |
| 2023 | $12,891 | $994,222 | $695,958 | $298,264 |
| 2022 | $12,598 | $974,728 | $682,312 | $292,416 |
| 2021 | $12,379 | $955,617 | $668,934 | $286,683 |
| 2020 | $12,640 | $945,819 | $662,075 | $283,744 |
| 2019 | $12,228 | $927,275 | $649,094 | $278,181 |
| 2018 | $11,815 | $909,094 | $636,367 | $272,727 |
| 2017 | $11,383 | $891,270 | $623,890 | $267,380 |
| 2016 | $11,178 | $873,795 | $611,657 | $262,138 |
| 2015 | $11,033 | $860,671 | $602,470 | $258,201 |
| 2014 | $10,752 | $843,812 | $590,668 | $253,144 |
Source: Public Records
Map
Nearby Homes
- 2931 San Bruno Ave
- 3101 San Bruno Ave
- 2626 San Bruno Ave
- 107 Dwight St
- 1830 Egbert Ave
- 819 Brussels St
- 406 Goettingen St
- 339 Paul Ave
- 248 Ordway St
- 548 Burrows St
- 5800 3rd St Unit 1102
- 5800 3rd St Unit 1121
- 5800 3rd St Unit 1417
- 5800 3rd St Unit 1105
- 5800 3rd St Unit 1401
- 1162 Bowdoin St
- 6246 3rd St
- 1081 Goettingen St
- 153 Silliman St
- 1740 Bancroft Ave Unit 4504
- 105 Woolsey St
- 2906 San Bruno Ave
- 125 Woolsey St
- 131 Woolsey St
- 2882-2888 San Bruno Ave
- 2882 San Bruno Ave
- 141 Woolsey St
- 2876 San Bruno Ave Unit 2878
- 122 Woolsey St
- 2914 San Bruno Ave
- 130 Woolsey St
- 147 Woolsey St
- 2870 San Bruno Ave
- 2915 San Bruno Ave
- 134 Woolsey St
- 2919 San Bruno Ave
- 625 Girard St
- 2925 San Bruno Ave
- 140 Woolsey St
- 631 Girard St