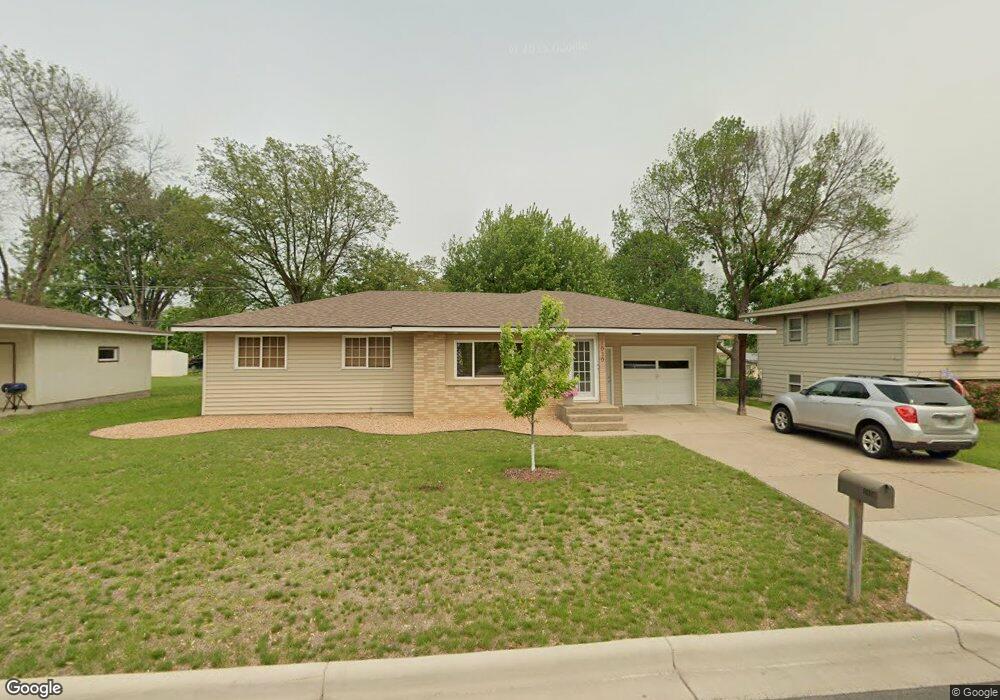
1030 15th St W Hastings, MN 55033
Hastings-Marshan Township NeighborhoodEstimated Value: $307,000 - $325,000
3
Beds
2
Baths
1,160
Sq Ft
$272/Sq Ft
Est. Value
About This Home
This home is located at 1030 15th St W, Hastings, MN 55033 and is currently estimated at $315,036, approximately $271 per square foot. 1030 15th St W is a home located in Dakota County with nearby schools including Pinecrest Elementary School, Hastings Middle School, and Hastings High School.
Ownership History
Date
Name
Owned For
Owner Type
Purchase Details
Closed on
Apr 30, 2024
Sold by
Coonrod Brianna
Bought by
Hansen Paul and Marek Kailey
Current Estimated Value
Home Financials for this Owner
Home Financials are based on the most recent Mortgage that was taken out on this home.
Original Mortgage
$292,602
Outstanding Balance
$288,389
Interest Rate
6.74%
Mortgage Type
New Conventional
Estimated Equity
$26,647
Purchase Details
Closed on
Feb 19, 2010
Sold by
Anderson Daniel C
Bought by
Coonrod Brianna R
Home Financials for this Owner
Home Financials are based on the most recent Mortgage that was taken out on this home.
Original Mortgage
$156,050
Interest Rate
5.5%
Mortgage Type
FHA
Purchase Details
Closed on
Jan 3, 2003
Sold by
Schaack Jennifer
Bought by
Anderson Daniel C
Purchase Details
Closed on
Sep 25, 1998
Sold by
Hix Linda
Bought by
Schaack Jennifer A
Create a Home Valuation Report for This Property
The Home Valuation Report is an in-depth analysis detailing your home's value as well as a comparison with similar homes in the area
Home Values in the Area
Average Home Value in this Area
Purchase History
| Date | Buyer | Sale Price | Title Company |
|---|---|---|---|
| Hansen Paul | $298,000 | -- | |
| Coonrod Brianna R | $159,000 | Dca | |
| Anderson Daniel C | $157,000 | -- | |
| Schaack Jennifer A | $110,000 | -- |
Source: Public Records
Mortgage History
| Date | Status | Borrower | Loan Amount |
|---|---|---|---|
| Open | Hansen Paul | $292,602 | |
| Previous Owner | Coonrod Brianna R | $156,050 |
Source: Public Records
Tax History Compared to Growth
Tax History
| Year | Tax Paid | Tax Assessment Tax Assessment Total Assessment is a certain percentage of the fair market value that is determined by local assessors to be the total taxable value of land and additions on the property. | Land | Improvement |
|---|---|---|---|---|
| 2024 | $2,982 | $270,400 | $69,500 | $200,900 |
| 2023 | $2,982 | $268,800 | $69,600 | $199,200 |
| 2022 | $2,520 | $268,300 | $69,500 | $198,800 |
| 2021 | $2,392 | $218,900 | $60,300 | $158,600 |
| 2020 | $2,392 | $207,900 | $57,500 | $150,400 |
| 2019 | $2,361 | $201,800 | $54,700 | $147,100 |
| 2018 | $2,230 | $190,700 | $52,100 | $138,600 |
| 2017 | $2,051 | $176,500 | $49,600 | $126,900 |
| 2016 | $2,303 | $164,300 | $46,400 | $117,900 |
| 2015 | $2,140 | $155,581 | $39,577 | $116,004 |
| 2014 | -- | $145,117 | $37,645 | $107,472 |
| 2013 | -- | $126,260 | $32,996 | $93,264 |
Source: Public Records
Map
Nearby Homes
- 1034 1034 15th-Street-w
- 1024 15th St W
- 1034 15th St W
- 1029 14th St W
- 1020 15th St W
- 1033 14th St W
- 1021 14th St W
- 1031 15th St W
- 1100 15th St W
- 1025 15th St W
- 1400 Lyn Way
- 1017 14th St W
- 1101 15th St W
- 1019 15th St W
- 1014 15th St W
- 1110 15th St W
- 1028 14th St W
- 1109 14th St W
- 1013 14th St W
- 1111 15th St W