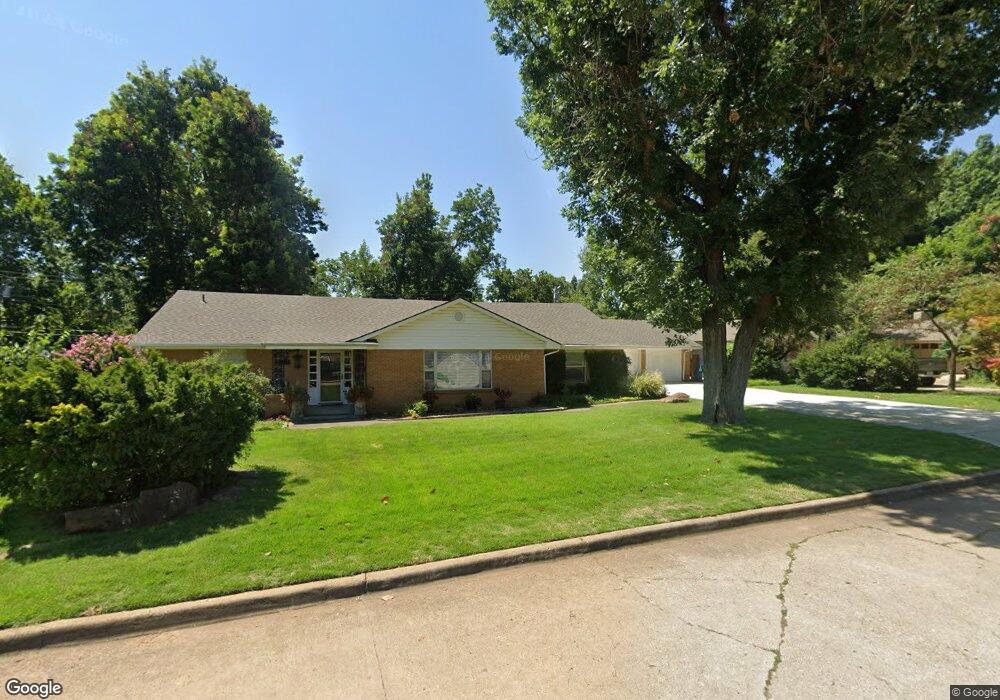
1030 Cruce St Norman, OK 73069
Southwest Norman NeighborhoodEstimated Value: $379,196 - $432,000
3
Beds
2
Baths
2,361
Sq Ft
$173/Sq Ft
Est. Value
About This Home
This home is located at 1030 Cruce St, Norman, OK 73069 and is currently estimated at $408,549, approximately $173 per square foot. 1030 Cruce St is a home located in Cleveland County with nearby schools including McKinley Elementary School, Alcott Middle School, and Norman High School.
Ownership History
Date
Name
Owned For
Owner Type
Purchase Details
Closed on
Apr 15, 2021
Sold by
Lewis Kathryn Roots and Lewis Kathryn Lester
Bought by
Lewis Jeffrey D and Lewis Kathryn Roots
Current Estimated Value
Home Financials for this Owner
Home Financials are based on the most recent Mortgage that was taken out on this home.
Original Mortgage
$301,500
Outstanding Balance
$16,172
Interest Rate
3%
Mortgage Type
Commercial
Estimated Equity
$392,377
Purchase Details
Closed on
Apr 9, 2021
Sold by
Lewis Kathryn Roots and Lewis Jeffrey D
Bought by
Lewis Jeffrey D and Lewis Kathryn Roots
Home Financials for this Owner
Home Financials are based on the most recent Mortgage that was taken out on this home.
Original Mortgage
$301,500
Outstanding Balance
$16,172
Interest Rate
3%
Mortgage Type
Commercial
Estimated Equity
$392,377
Create a Home Valuation Report for This Property
The Home Valuation Report is an in-depth analysis detailing your home's value as well as a comparison with similar homes in the area
Home Values in the Area
Average Home Value in this Area
Purchase History
| Date | Buyer | Sale Price | Title Company |
|---|---|---|---|
| Lewis Jeffrey D | -- | None Listed On Document | |
| Lewis Jeffrey D | -- | None Listed On Document | |
| Lewis Jeffrey D | -- | None Available |
Source: Public Records
Mortgage History
| Date | Status | Borrower | Loan Amount |
|---|---|---|---|
| Open | Lewis Jeffrey D | $301,500 | |
| Closed | Lewis Jeffrey D | $301,500 | |
| Closed | Lewis Jeffrey D | $301,500 |
Source: Public Records
Tax History
| Year | Tax Paid | Tax Assessment Tax Assessment Total Assessment is a certain percentage of the fair market value that is determined by local assessors to be the total taxable value of land and additions on the property. | Land | Improvement |
|---|---|---|---|---|
| 2025 | $2,475 | $22,314 | $4,731 | $17,583 |
| 2024 | $2,475 | $21,664 | $2,999 | $18,665 |
| 2023 | $2,405 | $21,033 | $2,182 | $18,851 |
| 2022 | $2,236 | $20,421 | $2,119 | $18,302 |
| 2021 | $2,285 | $19,826 | $2,057 | $17,769 |
| 2020 | $2,167 | $19,248 | $1,997 | $17,251 |
| 2019 | $2,137 | $18,688 | $1,939 | $16,749 |
| 2018 | $2,009 | $18,144 | $1,883 | $16,261 |
| 2017 | $1,968 | $23,125 | $0 | $0 |
| 2016 | $1,938 | $17,102 | $1,775 | $15,327 |
| 2015 | $1,823 | $16,604 | $1,230 | $15,374 |
| 2014 | $1,784 | $16,120 | $1,194 | $14,926 |
Source: Public Records
Map
Nearby Homes
- 1034 W Boyd St
- 716 S Pickard Ave
- 1121 W Apache St
- 1021 W Apache St
- 1117 W Symmes St
- 1614 Cruce St
- 1229 Westlawn Dr
- 1617 Avondale Dr
- 1119 W Eufaula St
- 1410 Huntington Way
- 1111 W Comanche St
- 230 W Symmes St
- 810 Hoover St
- 1315 Beverly Hills St
- 1100 Woodrow Ct
- 128 S Flood Ave
- 903 Garver St
- 1510 Melrose Dr
- 1511 Melrose Dr
- 3139 Wister Rd
Your Personal Tour Guide
Ask me questions while you tour the home.