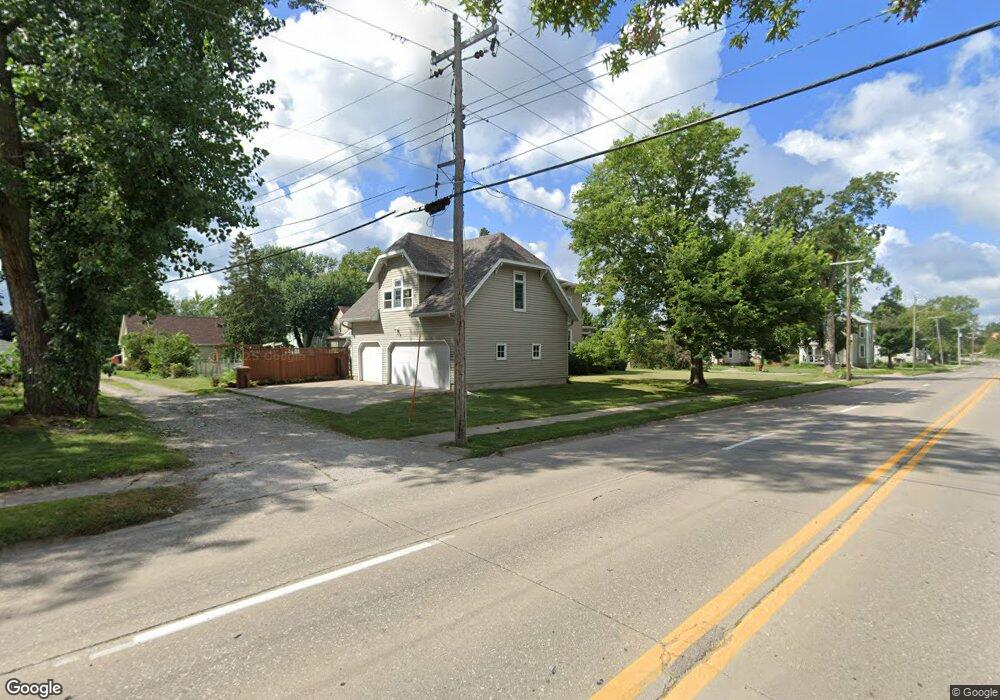
1030 Elm St Grinnell, IA 50112
Estimated Value: $360,527 - $433,000
7
Beds
5
Baths
3,338
Sq Ft
$119/Sq Ft
Est. Value
About This Home
This home is located at 1030 Elm St, Grinnell, IA 50112 and is currently estimated at $396,882, approximately $118 per square foot. 1030 Elm St is a home located in Poweshiek County with nearby schools including Grinnell Community Senior High School and Central Iowa Christian School.
Ownership History
Date
Name
Owned For
Owner Type
Purchase Details
Closed on
Jul 13, 2018
Sold by
Grabinski Deanne R
Bought by
Backlin Aaron and Backlin Lauren
Current Estimated Value
Home Financials for this Owner
Home Financials are based on the most recent Mortgage that was taken out on this home.
Original Mortgage
$271,600
Outstanding Balance
$235,902
Interest Rate
4.6%
Mortgage Type
New Conventional
Estimated Equity
$160,980
Create a Home Valuation Report for This Property
The Home Valuation Report is an in-depth analysis detailing your home's value as well as a comparison with similar homes in the area
Home Values in the Area
Average Home Value in this Area
Purchase History
| Date | Buyer | Sale Price | Title Company |
|---|---|---|---|
| Backlin Aaron | $280,000 | -- |
Source: Public Records
Mortgage History
| Date | Status | Borrower | Loan Amount |
|---|---|---|---|
| Open | Backlin Aaron | $271,600 |
Source: Public Records
Tax History Compared to Growth
Tax History
| Year | Tax Paid | Tax Assessment Tax Assessment Total Assessment is a certain percentage of the fair market value that is determined by local assessors to be the total taxable value of land and additions on the property. | Land | Improvement |
|---|---|---|---|---|
| 2025 | $5,482 | $344,680 | $41,410 | $303,270 |
| 2024 | $5,422 | $339,700 | $33,650 | $306,050 |
| 2023 | $5,564 | $339,700 | $33,650 | $306,050 |
| 2022 | $5,514 | $303,110 | $27,430 | $275,680 |
| 2021 | $5,514 | $285,960 | $25,880 | $260,080 |
| 2020 | $4,636 | $247,130 | $25,880 | $221,250 |
| 2019 | $4,708 | $247,130 | $25,880 | $221,250 |
| 2018 | $4,626 | $247,130 | $25,880 | $221,250 |
| 2017 | $4,728 | $247,130 | $25,880 | $221,250 |
| 2016 | $4,250 | $247,130 | $25,880 | $221,250 |
| 2015 | $4,250 | $223,950 | $25,490 | $198,460 |
| 2014 | $4,248 | $223,950 | $25,490 | $198,460 |
Source: Public Records
Map
Nearby Homes