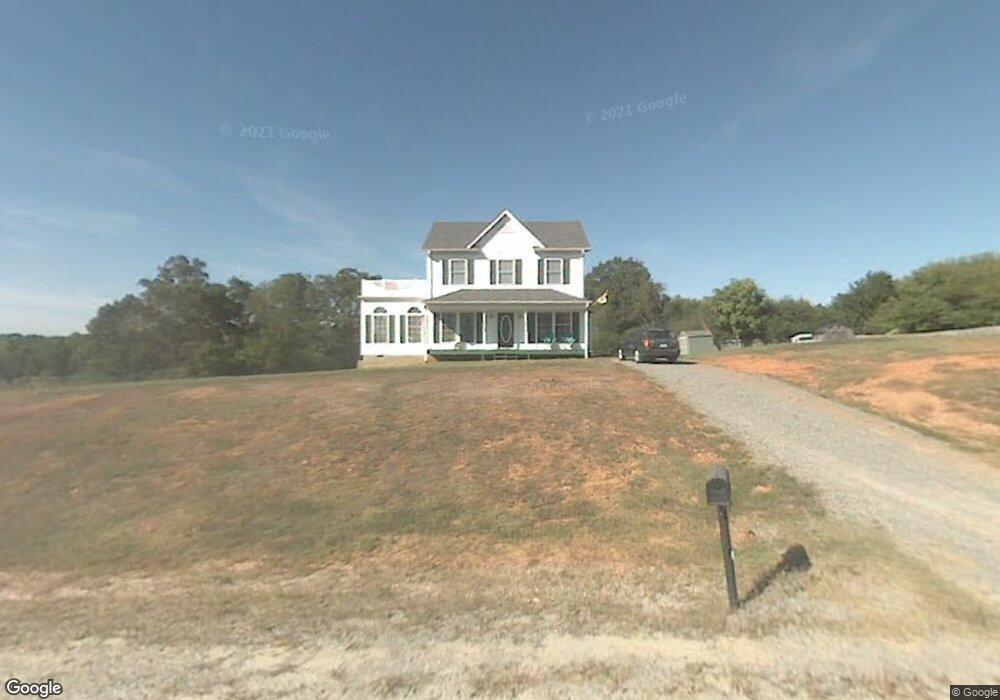
1030 Fox Hills Rd Pinnacle, NC 27043
Estimated Value: $208,000 - $339,000
3
Beds
3
Baths
1,823
Sq Ft
$153/Sq Ft
Est. Value
About This Home
This home is located at 1030 Fox Hills Rd, Pinnacle, NC 27043 and is currently estimated at $278,708, approximately $152 per square foot. 1030 Fox Hills Rd is a home located in Stokes County with nearby schools including Pinnacle Elementary School, Chestnut Grove Middle, and West Stokes High.
Ownership History
Date
Name
Owned For
Owner Type
Purchase Details
Closed on
Oct 7, 2016
Sold by
Mt Pilot Investments Llc
Bought by
Smith Billy Ray and Smith Robin Holmes
Current Estimated Value
Purchase Details
Closed on
Apr 26, 2013
Sold by
Mount Pilot Investments Llc
Bought by
Knight John Christopher
Home Financials for this Owner
Home Financials are based on the most recent Mortgage that was taken out on this home.
Original Mortgage
$131,000
Outstanding Balance
$98,876
Interest Rate
5%
Mortgage Type
Seller Take Back
Estimated Equity
$179,832
Purchase Details
Closed on
Nov 4, 2005
Sold by
Mount Pilot Partners
Bought by
Cummings Paul Tracy and Cummings Roberta Lynn
Home Financials for this Owner
Home Financials are based on the most recent Mortgage that was taken out on this home.
Original Mortgage
$147,450
Interest Rate
5.76%
Mortgage Type
Seller Take Back
Create a Home Valuation Report for This Property
The Home Valuation Report is an in-depth analysis detailing your home's value as well as a comparison with similar homes in the area
Purchase History
| Date | Buyer | Sale Price | Title Company |
|---|---|---|---|
| Smith Billy Ray | $650 | None Available | |
| Knight John Christopher | $136,000 | None Available | |
| Cummings Paul Tracy | $148,000 | None Available |
Source: Public Records
Mortgage History
| Date | Status | Borrower | Loan Amount |
|---|---|---|---|
| Open | Knight John Christopher | $131,000 | |
| Closed | Cummings Paul Tracy | $147,450 |
Source: Public Records
Tax History
| Year | Tax Paid | Tax Assessment Tax Assessment Total Assessment is a certain percentage of the fair market value that is determined by local assessors to be the total taxable value of land and additions on the property. | Land | Improvement |
|---|---|---|---|---|
| 2025 | $1,446 | $202,300 | $25,100 | $177,200 |
| 2024 | $1,446 | $148,900 | $20,500 | $128,400 |
| 2023 | $1,206 | $148,900 | $20,500 | $128,400 |
| 2022 | $1,102 | $148,900 | $20,500 | $128,400 |
| 2021 | $1,102 | $148,900 | $20,500 | $128,400 |
| 2020 | $988 | $133,500 | $19,500 | $114,000 |
| 2019 | $988 | $133,500 | $19,500 | $114,000 |
| 2018 | $988 | $133,500 | $19,500 | $114,000 |
| 2017 | $981 | $133,500 | $19,500 | $114,000 |
| 2016 | $943 | $128,300 | $19,500 | $108,800 |
| 2015 | $937 | $128,300 | $19,500 | $108,800 |
| 2014 | -- | $128,300 | $19,500 | $108,800 |
Source: Public Records
Map
Nearby Homes
- 1165 Flinty Knoll Rd
- 1458 Merridon Dr
- 0 Shady Ln
- 00 Grassy Knob Rd Unit 25
- 4075 E Nc Highway 268
- 00 Volunteer Rd Unit 1
- 00 Volunteer Rd Unit 2
- 00 Volunteer Rd Unit 3
- 1721 Camp Dogwood Rd
- 3859 Volunteer Rd
- 624 E 52 Bypass
- 1588 Pilot-Westfield Rd
- 0 N Old 52 Rd Unit 1203335
- 205 Crestwood Dr
- 528 E Main St
- 1591 Carson Rd
- 1015 Patterson Farm Rd
- 656 Hills Presbyterian Church Rd
- 00 Golf Course Rd
- 00 Carson Rd Unit 1.75
- 1050 Fox Hills Rd
- 00 Fox Hills Rd
- 1045 Fox Hills Rd
- 1010 Fox Hills Rd
- 18 Fox Hills Rd
- 9 Fox Hills Rd
- 20 Fox Hills Rd
- 0 Fox Hills Rd
- 1870 Oscar Frye Rd
- 1065 Fox Hills Rd
- 1050 Hunter Trail Rd
- 1020 Hunter Trail Rd
- 1844 Oscar Frye Rd
- 1023 Hunter Trail Rd
- xx 1 acre Hunter Trail Rd
- 1047 Hunter Trail Rd
- 1015 Hunter Trail Rd
- Lot 22 Hunter Trail
- 1928 Oscar Frye Rd
- 1942 Oscar Frye Rd
Your Personal Tour Guide
Ask me questions while you tour the home.