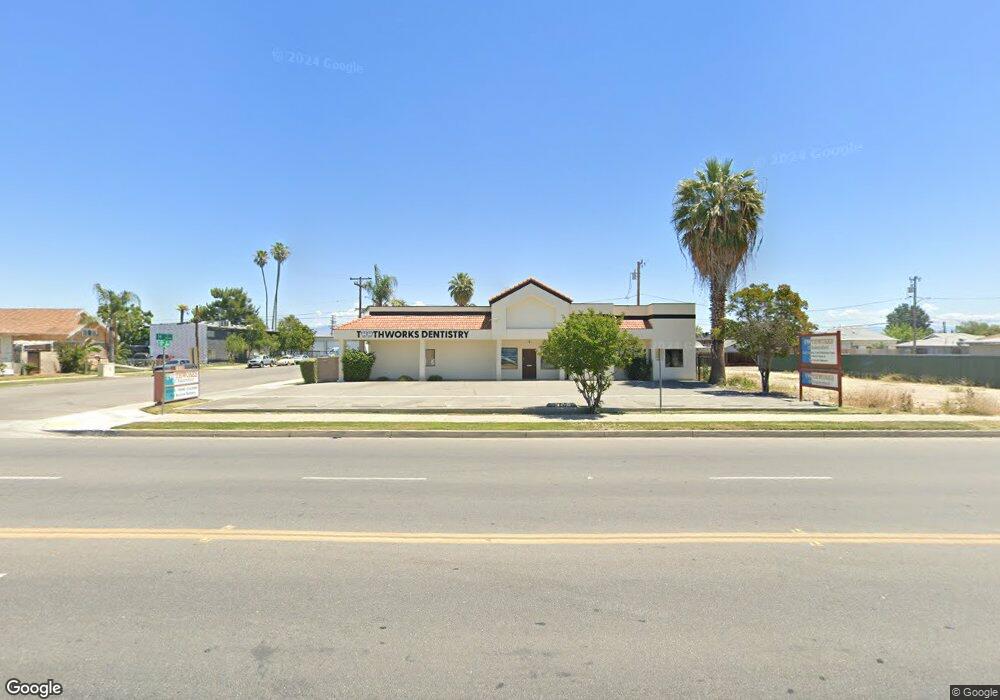
1030 H St Unit 2 Bakersfield, CA 93304
Oleander-Sunset NeighborhoodEstimated Value: $749,621
Studio
--
Bath
3,083
Sq Ft
$243/Sq Ft
Est. Value
About This Home
This home is located at 1030 H St Unit 2, Bakersfield, CA 93304 and is currently estimated at $749,621, approximately $243 per square foot. 1030 H St Unit 2 is a home located in Kern County with nearby schools including Roosevelt Elementary School, Emerson Middle School, and Bakersfield High School.
Ownership History
Date
Name
Owned For
Owner Type
Purchase Details
Closed on
Mar 11, 2025
Sold by
1030 H Street Llc
Bought by
1030 H St Bakersfield Llc
Current Estimated Value
Home Financials for this Owner
Home Financials are based on the most recent Mortgage that was taken out on this home.
Original Mortgage
$1,000,000
Outstanding Balance
$994,961
Interest Rate
6.95%
Mortgage Type
New Conventional
Estimated Equity
-$245,340
Purchase Details
Closed on
Dec 1, 2022
Sold by
Sandoval Roger Ann and Sandoval Martha A
Bought by
1030 H Street Llc
Home Financials for this Owner
Home Financials are based on the most recent Mortgage that was taken out on this home.
Original Mortgage
$556,000
Interest Rate
7.08%
Mortgage Type
New Conventional
Create a Home Valuation Report for This Property
The Home Valuation Report is an in-depth analysis detailing your home's value as well as a comparison with similar homes in the area
Home Values in the Area
Average Home Value in this Area
Purchase History
| Date | Buyer | Sale Price | Title Company |
|---|---|---|---|
| 1030 H St Bakersfield Llc | $750,000 | Orange Coast Title | |
| 1030 H Street Llc | $695,000 | Orange Coast Title |
Source: Public Records
Mortgage History
| Date | Status | Borrower | Loan Amount |
|---|---|---|---|
| Open | 1030 H St Bakersfield Llc | $1,000,000 | |
| Previous Owner | 1030 H Street Llc | $556,000 |
Source: Public Records
Tax History
| Year | Tax Paid | Tax Assessment Tax Assessment Total Assessment is a certain percentage of the fair market value that is determined by local assessors to be the total taxable value of land and additions on the property. | Land | Improvement |
|---|---|---|---|---|
| 2025 | $8,583 | $723,078 | $156,060 | $567,018 |
| 2024 | $8,583 | $708,900 | $153,000 | $555,900 |
| 2023 | $8,432 | $695,000 | $150,000 | $545,000 |
| 2022 | $6,556 | $533,693 | $132,014 | $401,679 |
| 2021 | $6,593 | $523,229 | $129,426 | $393,803 |
| 2020 | $6,593 | $517,865 | $128,099 | $389,766 |
| 2019 | $6,454 | $517,865 | $128,099 | $389,766 |
| 2018 | $6,300 | $497,758 | $123,126 | $374,632 |
| 2017 | $6,280 | $487,999 | $120,712 | $367,287 |
| 2016 | $5,674 | $478,432 | $118,346 | $360,086 |
| 2015 | $5,659 | $471,247 | $116,569 | $354,678 |
| 2014 | $5,371 | $462,017 | $114,286 | $347,731 |
Source: Public Records
Map
Nearby Homes
Your Personal Tour Guide
Ask me questions while you tour the home.