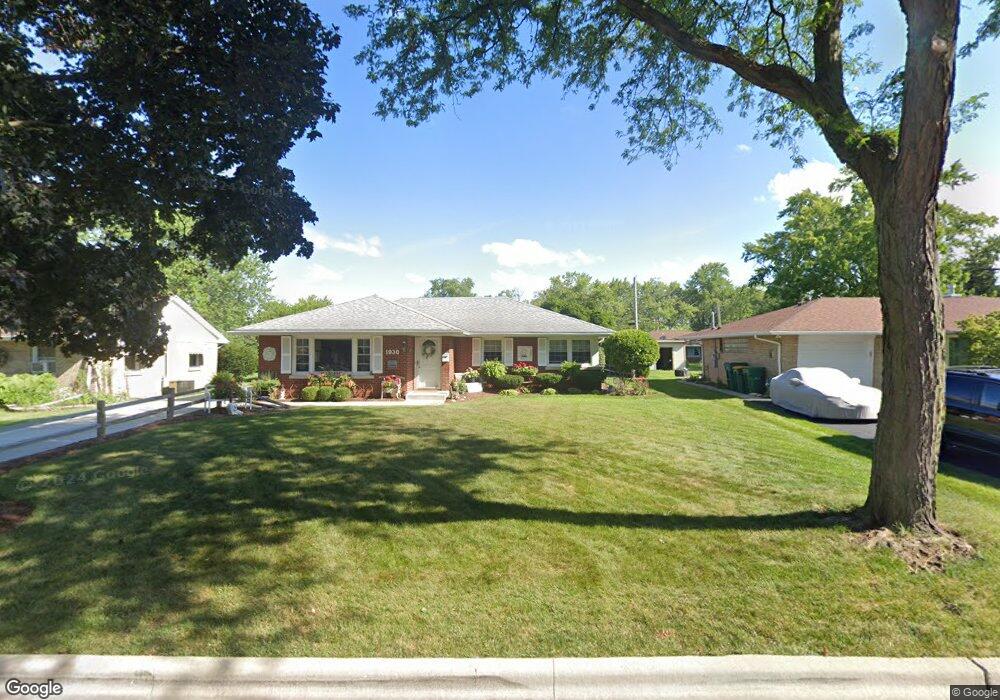
1030 Holly Ct Unit 5A Lockport, IL 60441
Estimated Value: $292,414 - $358,000
Studio
--
Bath
--
Sq Ft
8,712
Sq Ft
About This Home
This home is located at 1030 Holly Ct Unit 5A, Lockport, IL 60441 and is currently estimated at $335,104. 1030 Holly Ct Unit 5A is a home located in Will County with nearby schools including Milne Grove Elementary School, Kelvin Grove Jr High School, and Lockport Township High School East.
Ownership History
Date
Name
Owned For
Owner Type
Purchase Details
Closed on
May 5, 2011
Sold by
Pesavento Bonnie L and Stapinski Bonnie
Bought by
Pesavento Bonnie L and Pesavento John R
Current Estimated Value
Home Financials for this Owner
Home Financials are based on the most recent Mortgage that was taken out on this home.
Original Mortgage
$89,200
Outstanding Balance
$5,470
Interest Rate
4.8%
Mortgage Type
New Conventional
Estimated Equity
$329,634
Purchase Details
Closed on
Dec 1, 1997
Sold by
Mcconnell Aouda M and Belander William A
Bought by
Stapinski Bonnie
Home Financials for this Owner
Home Financials are based on the most recent Mortgage that was taken out on this home.
Original Mortgage
$75,000
Interest Rate
7.24%
Purchase Details
Closed on
Aug 1, 1996
Sold by
Belander Francis Andrew and Mcconnell Aouda M
Bought by
Mcconnell Aouda M and Belander William A
Purchase Details
Closed on
May 1, 1993
Sold by
Belander Francis Andrew
Bought by
Belander Francis Andrew and Mcconnell Aouda M
Create a Home Valuation Report for This Property
The Home Valuation Report is an in-depth analysis detailing your home's value as well as a comparison with similar homes in the area
Home Values in the Area
Average Home Value in this Area
Purchase History
| Date | Buyer | Sale Price | Title Company |
|---|---|---|---|
| Pesavento Bonnie L | -- | Multiple | |
| Stapinski Bonnie | $125,000 | -- | |
| Mcconnell Aouda M | -- | -- | |
| Belander Francis Andrew | -- | -- |
Source: Public Records
Mortgage History
| Date | Status | Borrower | Loan Amount |
|---|---|---|---|
| Open | Pesavento Bonnie L | $89,200 | |
| Previous Owner | Stapinski Bonnie | $75,000 |
Source: Public Records
Tax History
| Year | Tax Paid | Tax Assessment Tax Assessment Total Assessment is a certain percentage of the fair market value that is determined by local assessors to be the total taxable value of land and additions on the property. | Land | Improvement |
|---|---|---|---|---|
| 2024 | $6,639 | $93,326 | $23,568 | $69,758 |
| 2023 | $6,639 | $83,783 | $21,158 | $62,625 |
| 2022 | $6,491 | $81,511 | $19,736 | $61,775 |
| 2021 | $6,114 | $76,601 | $18,547 | $58,054 |
| 2020 | $5,938 | $74,082 | $17,937 | $56,145 |
| 2019 | $5,608 | $70,220 | $17,002 | $53,218 |
| 2018 | $5,293 | $65,558 | $15,873 | $49,685 |
| 2017 | $5,057 | $61,888 | $14,984 | $46,904 |
| 2016 | $4,631 | $62,036 | $15,020 | $47,016 |
| 2015 | $5,036 | $59,026 | $14,291 | $44,735 |
| 2014 | $5,036 | $57,307 | $13,875 | $43,432 |
| 2013 | $5,036 | $58,476 | $14,158 | $44,318 |
Source: Public Records
Map
Nearby Homes
- 1041 Ashley Ct S Unit 2D
- 1222 Will Dr
- 1330 Lacoma Ct
- 1015 Grandview Ave
- 1509 Peachtree Ln
- 16901 Ennerdale Ave
- 17004 Geneva Ave
- 1513 Connor Ave
- 417 Thornton St
- 310 Mccameron Ave
- 1509 East St Unit ST1511
- 1505 East St
- 16937 Mendota Dr
- 519 S Washington St
- 17009 Mendota Dr
- 1112 S Jefferson St
- 17558 W Windemere Cir
- 501 S Hamilton St
- 17053 Mendota Dr
- 17120 Carlislie Ln
Your Personal Tour Guide
Ask me questions while you tour the home.