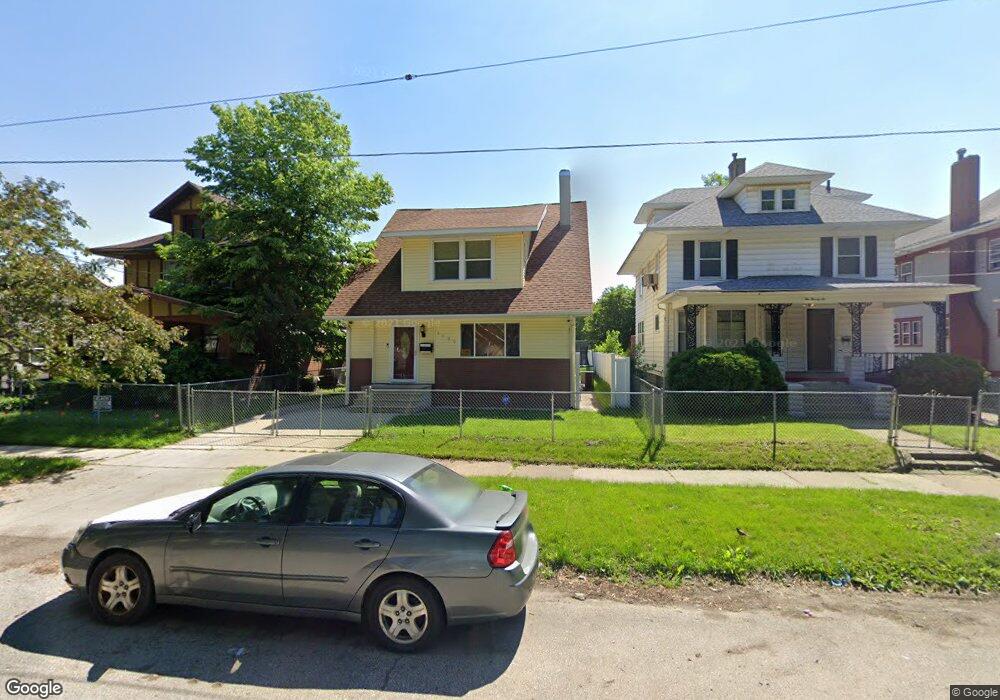
1030 Logan Ave Waterloo, IA 50703
Common Grounds NeighborhoodEstimated Value: $87,000 - $112,414
3
Beds
1
Bath
1,607
Sq Ft
$64/Sq Ft
Est. Value
About This Home
This home is located at 1030 Logan Ave, Waterloo, IA 50703 and is currently estimated at $102,854, approximately $64 per square foot. 1030 Logan Ave is a home located in Black Hawk County with nearby schools including Lincoln Elementary School, George Washington Carver Academy, and East High School.
Ownership History
Date
Name
Owned For
Owner Type
Purchase Details
Closed on
Dec 11, 2020
Sold by
Manning Terrel and Manning Deshai R
Bought by
Dillard Ashley Monique
Current Estimated Value
Home Financials for this Owner
Home Financials are based on the most recent Mortgage that was taken out on this home.
Original Mortgage
$11,850
Outstanding Balance
$8,460
Interest Rate
2.26%
Mortgage Type
New Conventional
Estimated Equity
$94,394
Purchase Details
Closed on
Jul 12, 2018
Sold by
Manning Deshai R and Manning Terrel
Bought by
Manning Deshai R and Manning Terrel
Purchase Details
Closed on
Mar 27, 2007
Sold by
Cafaro Della and Cafaro James P
Bought by
Della J Cafaro Revocable Family Trust
Create a Home Valuation Report for This Property
The Home Valuation Report is an in-depth analysis detailing your home's value as well as a comparison with similar homes in the area
Home Values in the Area
Average Home Value in this Area
Purchase History
| Date | Buyer | Sale Price | Title Company |
|---|---|---|---|
| Dillard Ashley Monique | $79,000 | None Available | |
| Manning Deshai R | -- | -- | |
| Della J Cafaro Revocable Family Trust | -- | None Available |
Source: Public Records
Mortgage History
| Date | Status | Borrower | Loan Amount |
|---|---|---|---|
| Open | Dillard Ashley Monique | $11,850 | |
| Open | Dillard Ashley Monique | $63,200 |
Source: Public Records
Tax History Compared to Growth
Tax History
| Year | Tax Paid | Tax Assessment Tax Assessment Total Assessment is a certain percentage of the fair market value that is determined by local assessors to be the total taxable value of land and additions on the property. | Land | Improvement |
|---|---|---|---|---|
| 2025 | $1,576 | $100,180 | $5,250 | $94,930 |
| 2024 | $1,576 | $82,880 | $5,250 | $77,630 |
| 2023 | $1,116 | $82,880 | $5,250 | $77,630 |
| 2022 | $1,084 | $59,700 | $5,250 | $54,450 |
| 2021 | $1,078 | $59,700 | $5,250 | $54,450 |
| 2020 | $1,056 | $56,170 | $4,040 | $52,130 |
| 2019 | $1,056 | $56,170 | $4,040 | $52,130 |
| 2018 | $1,058 | $56,170 | $4,040 | $52,130 |
| 2017 | $986 | $56,170 | $4,040 | $52,130 |
| 2016 | $968 | $51,430 | $4,040 | $47,390 |
| 2015 | $968 | $51,430 | $4,040 | $47,390 |
| 2014 | $988 | $51,430 | $4,040 | $47,390 |
Source: Public Records
Map
Nearby Homes