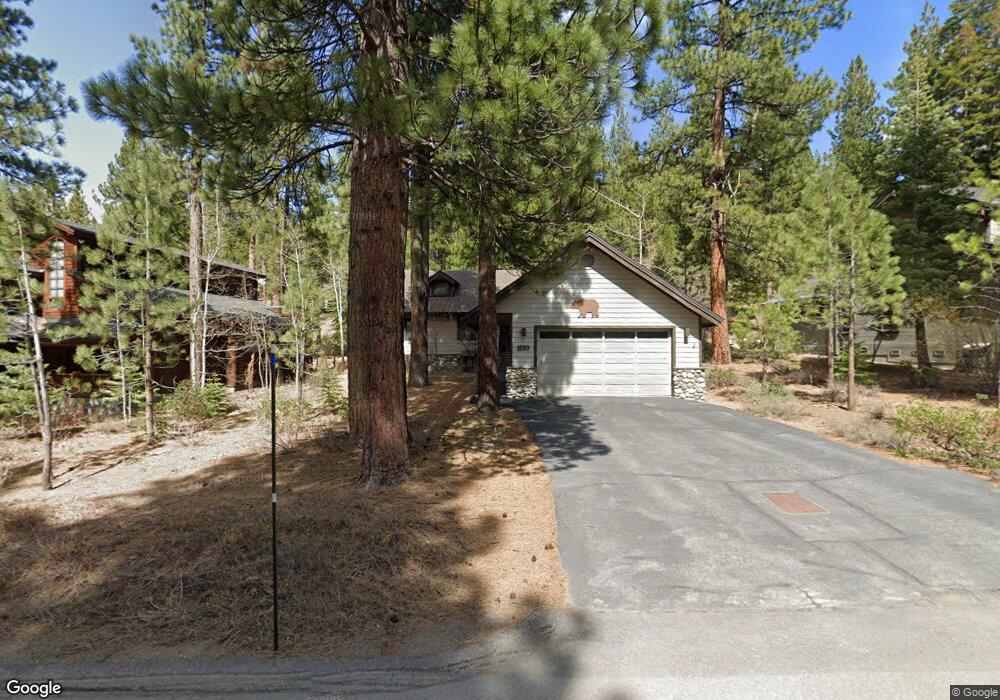
1030 Martis Landing Truckee, CA 96161
South Truckee NeighborhoodEstimated Value: $1,450,000 - $1,729,000
4
Beds
3
Baths
2,235
Sq Ft
$710/Sq Ft
Est. Value
About This Home
This home is located at 1030 Martis Landing, Truckee, CA 96161 and is currently estimated at $1,587,605, approximately $710 per square foot. 1030 Martis Landing is a home located in Placer County with nearby schools including Truckee Elementary School, Alder Creek Middle School, and Tahoe Truckee High School.
Ownership History
Date
Name
Owned For
Owner Type
Purchase Details
Closed on
Nov 8, 2019
Sold by
Hutton Thomas S
Bought by
Hutton Thomas S
Current Estimated Value
Purchase Details
Closed on
Apr 22, 2011
Sold by
Davidson Gordon K and Davidson Carolyn S
Bought by
Hutton Thomas S and Hutton Andrea S
Purchase Details
Closed on
May 5, 2000
Sold by
Flanagan and Gayle
Bought by
Davidson Gordon K and Davidson Carolyn S
Home Financials for this Owner
Home Financials are based on the most recent Mortgage that was taken out on this home.
Original Mortgage
$495,000
Interest Rate
8%
Mortgage Type
Purchase Money Mortgage
Purchase Details
Closed on
Jan 6, 1995
Sold by
Oconnell Dennis J and Oconnell Mikel A
Bought by
Oconnell Dennis John and Oconnell Mikel Ann
Create a Home Valuation Report for This Property
The Home Valuation Report is an in-depth analysis detailing your home's value as well as a comparison with similar homes in the area
Home Values in the Area
Average Home Value in this Area
Purchase History
| Date | Buyer | Sale Price | Title Company |
|---|---|---|---|
| Hutton Thomas S | -- | None Available | |
| Hutton Thomas S | $836,000 | Fidelity National Title Comp | |
| Davidson Gordon K | $660,000 | Fidelity National Title | |
| Oconnell Dennis John | -- | -- |
Source: Public Records
Mortgage History
| Date | Status | Borrower | Loan Amount |
|---|---|---|---|
| Previous Owner | Davidson Gordon K | $495,000 |
Source: Public Records
Tax History Compared to Growth
Tax History
| Year | Tax Paid | Tax Assessment Tax Assessment Total Assessment is a certain percentage of the fair market value that is determined by local assessors to be the total taxable value of land and additions on the property. | Land | Improvement |
|---|---|---|---|---|
| 2025 | $13,614 | $1,058,240 | $256,230 | $802,010 |
| 2023 | $13,614 | $1,017,149 | $246,281 | $770,868 |
| 2022 | $13,227 | $997,205 | $241,452 | $755,753 |
| 2021 | $12,454 | $977,653 | $236,718 | $740,935 |
| 2020 | $12,529 | $967,629 | $234,291 | $733,338 |
| 2019 | $12,576 | $948,657 | $229,698 | $718,959 |
| 2018 | $12,106 | $930,057 | $225,195 | $704,862 |
| 2017 | $11,891 | $911,822 | $220,780 | $691,042 |
| 2016 | $11,812 | $893,944 | $216,451 | $677,493 |
| 2015 | $11,521 | $880,517 | $213,200 | $667,317 |
| 2014 | $11,846 | $863,270 | $209,024 | $654,246 |
Source: Public Records
Map
Nearby Homes
- 1055 Martis Landing Unit B
- 6138 Feather Ridge
- 6133 Feather Ridge
- 5107 Gold Bend
- 5080 Gold Bend
- 5053 Gold Bend
- 5030 Gold Bend
- 6070 Rocky Point Cir
- 1723 Grouse Ridge Rd Unit 4
- 2640 Mill Site Rd
- 2790 Cross Cut Ct
- 7201 Larkspur Ln Unit 4
- 7401 Larkspur Ln Unit 1
- 2785 Cross Cut Ct
- 1937 Gray Wolf
- 1750 Grouse Ridge Rd
- 3066 Silver Strike
- 139 Basque Dr
- 253 Basque Dr Unit Share 2
- 237 Basque Dr Unit 2
- 1032 Martis Landing
- 1028 Martis Landing
- 1055 Martis Landing Unit A
- 1055 Martis Landing Unit 2
- 1080 Martis Landing
- 1046 Martis Landing
- 1300 Indian Hills
- 1026 Martis Landing
- 1036 Martis Landing
- 1301 Indian Hills
- 1501 Logging Trail
- 1302 Indian Hills
- 1024 Martis Landing
- 1025 Martis Landing
- 1038 Martis Landing
- 1304 Indian Hills
- 1503 Logging Trail
- 1023 Martis Landing
- 1022 Martis Landing
- 1040 Martis Landing