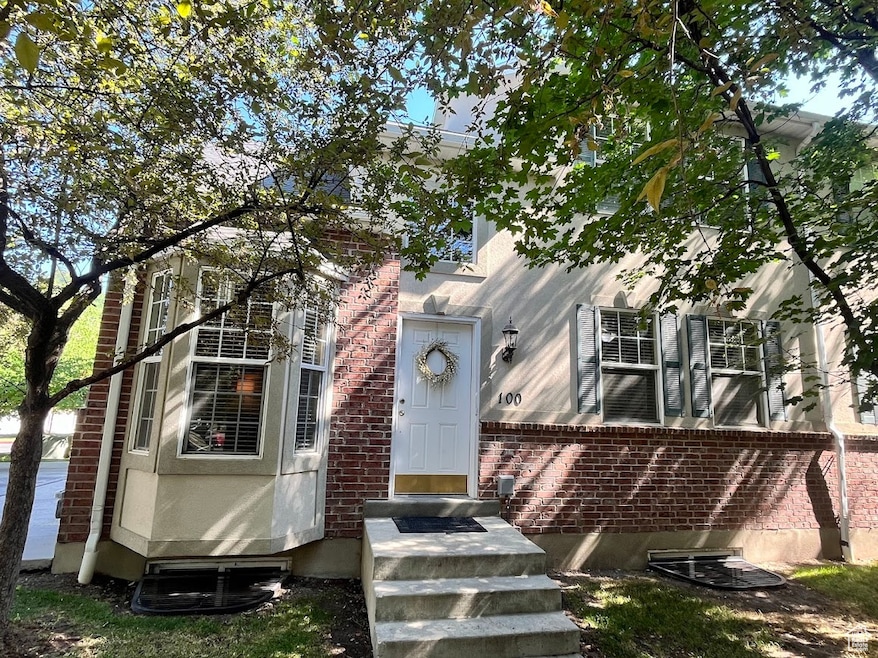
1030 N 130 W Unit 100 Logan, UT 84341
Bridger NeighborhoodEstimated payment $2,338/month
Highlights
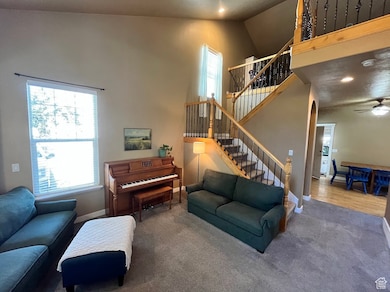
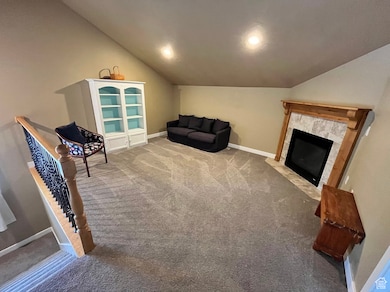
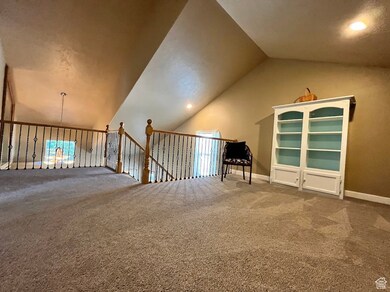
- Vaulted Ceiling
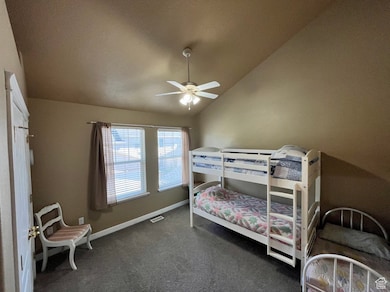
- Main Floor Primary Bedroom
- 1 Fireplace
- Wood Flooring
- Hydromassage or Jetted Bathtub
- Porch
About This Home
SPACIOUS END-UNIT TOWNHOME! IDEAL LOCATION! Walking distance to parks, restaurants, shopping, etc. Bus Stop nearby. 4 Beds, 3 1/2 baths...Lots Of Space! 2 Car ATTACHED GARAGE. Interior features include hardwood floors, vaulted ceilings, spacious loft and large great rooms. Great for all ages...primary bed/bath is on the main level. Call or text with questions.
Townhouse Details
Home Type
- Townhome
Est. Annual Taxes
- $1,654
Year Built
- Built in 2003
Lot Details
- 1,307 Sq Ft Lot
- Landscaped
- Sprinkler System
HOA Fees
- $175 Monthly HOA Fees
Parking
- 2 Car Attached Garage
Home Design
- Brick Exterior Construction
- Stucco
Interior Spaces
- 2,630 Sq Ft Home
- 3-Story Property
- Vaulted Ceiling
- 1 Fireplace
- Double Pane Windows
- Basement Fills Entire Space Under The House
- Electric Dryer Hookup
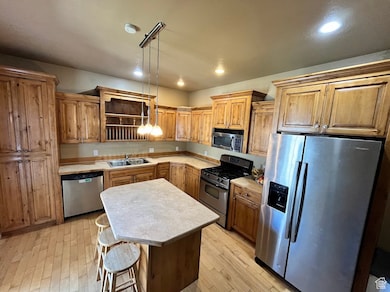
Kitchen
- Gas Oven
- Free-Standing Range
- Disposal
Flooring
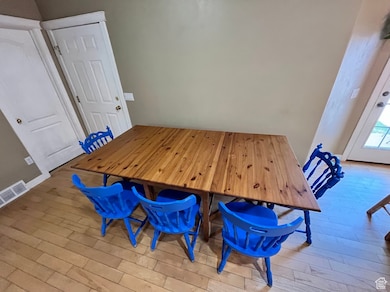
- Wood
- Carpet
- Tile
Bedrooms and Bathrooms
- 4 Bedrooms | 1 Primary Bedroom on Main
- Walk-In Closet
- Hydromassage or Jetted Bathtub
Outdoor Features
- Open Patio
- Porch
Schools
- Adams Elementary School
- Mt Logan Middle School
- Logan High School
Utilities
- Forced Air Heating and Cooling System
- Natural Gas Connected
Listing and Financial Details
- Assessor Parcel Number 05-101-0031
Community Details
Overview
- Association fees include ground maintenance
- Skyler Parkhurst Association, Phone Number (385) 216-7796
- Lexington Village Subdivision
Amenities
- Community Barbecue Grill
- Picnic Area
Recreation
- Community Playground
- Snow Removal
Map
Home Values in the Area
Average Home Value in this Area
Tax History
| Year | Tax Paid | Tax Assessment Tax Assessment Total Assessment is a certain percentage of the fair market value that is determined by local assessors to be the total taxable value of land and additions on the property. | Land | Improvement |
|---|---|---|---|---|
| 2025 | $1,653 | $213,835 | $0 | $0 |
| 2024 | $1,734 | $217,155 | $0 | $0 |
| 2023 | $1,695 | $202,400 | $0 | $0 |
| 2022 | $1,815 | $202,400 | $0 | $0 |
| 2021 | $1,643 | $283,045 | $70,000 | $213,045 |
| 2020 | $1,435 | $222,455 | $48,000 | $174,455 |
| 2019 | $1,500 | $222,455 | $48,000 | $174,455 |
| 2018 | $1,475 | $199,700 | $48,000 | $151,700 |
| 2017 | $1,390 | $99,550 | $0 | $0 |
| 2016 | $1,441 | $90,530 | $0 | $0 |
| 2015 | $1,139 | $78,595 | $0 | $0 |
| 2014 | $1,030 | $78,595 | $0 | $0 |
| 2013 | -- | $78,595 | $0 | $0 |
Property History
| Date | Event | Price | List to Sale | Price per Sq Ft |
|---|---|---|---|---|
| 09/12/2025 09/12/25 | Price Changed | $385,000 | -1.4% | $146 / Sq Ft |
| 08/18/2025 08/18/25 | Price Changed | $390,500 | -0.5% | $148 / Sq Ft |
| 08/07/2025 08/07/25 | Price Changed | $392,500 | -0.5% | $149 / Sq Ft |
| 07/23/2025 07/23/25 | For Sale | $394,500 | -- | $150 / Sq Ft |
Purchase History
| Date | Type | Sale Price | Title Company |
|---|---|---|---|
| Interfamily Deed Transfer | -- | Hickman Land Title Logan | |
| Warranty Deed | -- | Hickman Land Title Logan | |
| Trustee Deed | $140,100 | None Available | |
| Warranty Deed | -- | Cache Title Company |
Mortgage History
| Date | Status | Loan Amount | Loan Type |
|---|---|---|---|
| Open | $126,000 | New Conventional | |
| Previous Owner | $148,000 | New Conventional |
Source: UtahRealEstate.com
MLS Number: 2100462
APN: 05-101-0031
Disclaimer: Certain information contained herein is derived from information provided by parties other than Homes.com. All information provided is deemed reliable, but is not guaranteed to be accurate and should be independently verified.
![]() IDX information is provided exclusively for consumers’ personal, non-commercial use, that it may not be used for any purpose other than to identify prospective properties consumers may be interested in purchasing, and that the data is deemed reliable but is not guaranteed accurate by the MLS. Licensor is only providing the MLS Content and not other sources of data provided in the Product.
IDX information is provided exclusively for consumers’ personal, non-commercial use, that it may not be used for any purpose other than to identify prospective properties consumers may be interested in purchasing, and that the data is deemed reliable but is not guaranteed accurate by the MLS. Licensor is only providing the MLS Content and not other sources of data provided in the Product.
Based on information from the Wasatch Front Regional Multiple Listing Service, Inc.. All data, including all measurements and calculations of area, is obtained from various sources and has not been, and will not be, verified by broker or the MLS. All information should be independently reviewed and verified for accuracy. Properties may or may not be listed by the office/agent presenting the information.
