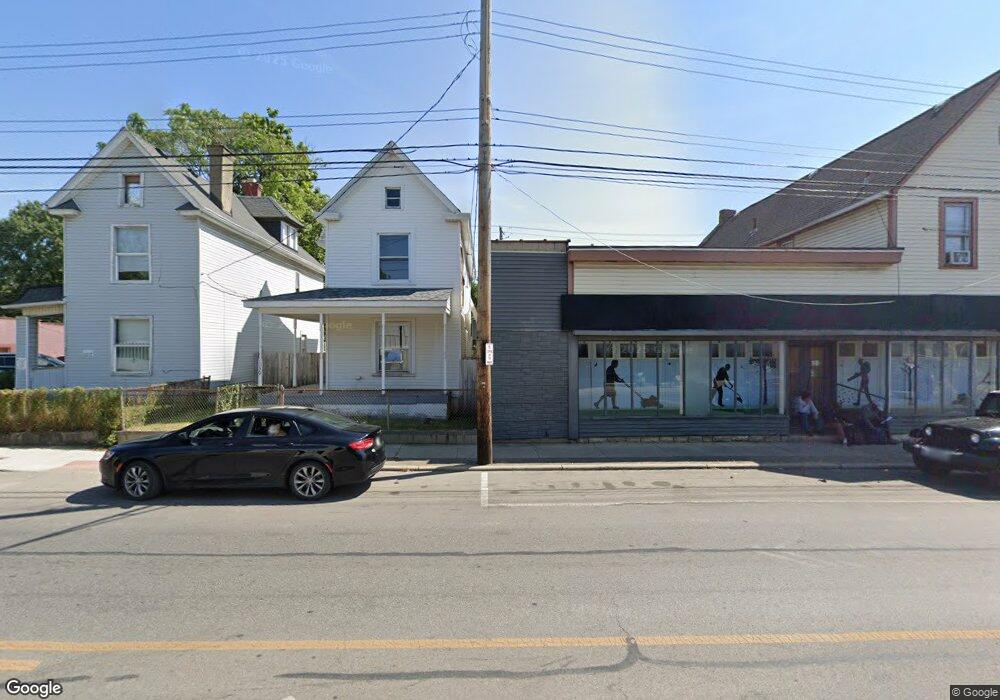
1030 Parsons Ave Columbus, OH 43206
Karns Park NeighborhoodEstimated Value: $129,000 - $307,000
3
Beds
1
Bath
1,400
Sq Ft
$143/Sq Ft
Est. Value
About This Home
This home is located at 1030 Parsons Ave, Columbus, OH 43206 and is currently estimated at $200,678, approximately $143 per square foot. 1030 Parsons Ave is a home located in Franklin County with nearby schools including Siebert Elementary School, South High School, and South Columbus Preparatory Academy.
Ownership History
Date
Name
Owned For
Owner Type
Purchase Details
Closed on
Oct 29, 2025
Sold by
Foundation First Properties Llc
Bought by
Cohen Management Llc
Current Estimated Value
Purchase Details
Closed on
Nov 16, 2018
Sold by
Parsons Holdings Llc
Bought by
Foundation First Properties Llc
Purchase Details
Closed on
Jun 21, 2017
Sold by
Gogan Andrew L and Gogan Michelle L
Bought by
Parsons Holdings Llc
Purchase Details
Closed on
Dec 11, 2015
Sold by
Ed Ross Construction Co
Bought by
Gogan Andrew L and Gogan Michelle L
Purchase Details
Closed on
Jan 8, 1997
Sold by
Wright Harry D
Bought by
Ed Ross Const Co
Home Financials for this Owner
Home Financials are based on the most recent Mortgage that was taken out on this home.
Original Mortgage
$15,000
Interest Rate
7.58%
Mortgage Type
New Conventional
Purchase Details
Closed on
Oct 15, 1996
Sold by
Haight Leona M
Bought by
Ed Ross Const Co & Harry D Wright
Purchase Details
Closed on
Aug 1, 1985
Create a Home Valuation Report for This Property
The Home Valuation Report is an in-depth analysis detailing your home's value as well as a comparison with similar homes in the area
Home Values in the Area
Average Home Value in this Area
Purchase History
| Date | Buyer | Sale Price | Title Company |
|---|---|---|---|
| Cohen Management Llc | $125,000 | Pm Title | |
| Foundation First Properties Llc | $27,500 | Service Title Box | |
| Parsons Holdings Llc | -- | None Available | |
| Gogan Andrew L | $1,000 | First American | |
| Ed Ross Const Co | $14,827 | -- | |
| Ed Ross Const Co & Harry D Wright | $26,000 | -- | |
| -- | -- | -- |
Source: Public Records
Mortgage History
| Date | Status | Borrower | Loan Amount |
|---|---|---|---|
| Previous Owner | Ed Ross Const Co | $15,000 |
Source: Public Records
Tax History Compared to Growth
Tax History
| Year | Tax Paid | Tax Assessment Tax Assessment Total Assessment is a certain percentage of the fair market value that is determined by local assessors to be the total taxable value of land and additions on the property. | Land | Improvement |
|---|---|---|---|---|
| 2024 | $640 | $13,970 | $4,240 | $9,730 |
| 2023 | $632 | $13,970 | $4,240 | $9,730 |
| 2022 | $999 | $9,700 | $3,640 | $6,060 |
| 2021 | $666 | $9,700 | $3,640 | $6,060 |
| 2020 | $667 | $9,700 | $3,640 | $6,060 |
| 2019 | $857 | $8,400 | $3,150 | $5,250 |
| 2018 | $640 | $8,400 | $3,150 | $5,250 |
| 2017 | $522 | $8,400 | $3,150 | $5,250 |
| 2016 | $832 | $12,250 | $3,150 | $9,100 |
| 2015 | $758 | $12,250 | $3,150 | $9,100 |
| 2014 | $760 | $12,250 | $3,150 | $9,100 |
| 2013 | $375 | $12,250 | $3,150 | $9,100 |
Source: Public Records
Map
Nearby Homes
- 547 E Whittier St
- 480 Siebert St
- 479 Siebert St
- 486 E Whittier St
- 472 E Whittier St
- 596 E Whittier St
- 556 Stanley Ave
- 578 Stewart Ave
- 490 Stanley Ave
- 1106-1116 Parsons Ave
- 520 Cline St
- 613 Siebert St
- 611 Siebert St
- 497 E Kossuth St
- 644 Stanley Ave
- 420 Stanley Ave
- 519-521 E Deshler Ave
- 531 E Deshler Ave
- 575 E Columbus St Unit 577
- 1178 Wager St
- 1026 Parsons Ave
- 1038 Parsons Ave
- 520 Siebert St
- 528 Siebert St
- 1016 1/2 Parsons Ave
- 1014 Parsons Ave
- 530 Siebert St
- 1025 Parsons Ave
- 1048 Parsons Ave
- 536 Siebert St
- 1037 Parsons Ave
- 1037 Parsons Ave Unit 1
- 540 Siebert St
- 1004 Parsons Ave
- 535 Reinhard Ave
- 1008 Parsons Ave
- 1058 Parsons Ave
- 539 Reinhard Ave
- 523 Siebert St
- 544 Siebert St