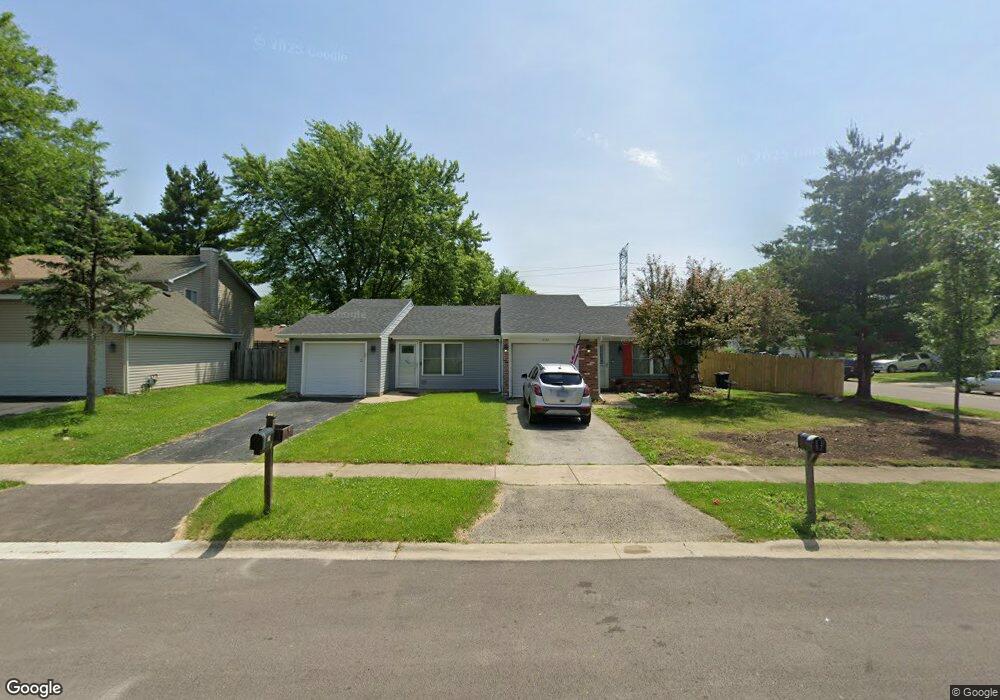
1030 Pheasant Run Ln Unit 16C Aurora, IL 60504
South East Village NeighborhoodEstimated Value: $203,000 - $253,326
Studio
1
Bath
864
Sq Ft
$256/Sq Ft
Est. Value
About This Home
This home is located at 1030 Pheasant Run Ln Unit 16C, Aurora, IL 60504 and is currently estimated at $221,082, approximately $255 per square foot. 1030 Pheasant Run Ln Unit 16C is a home located in DuPage County with nearby schools including Georgetown Elementary School, Fischer Middle School, and Waubonsie Valley High School.
Ownership History
Date
Name
Owned For
Owner Type
Purchase Details
Closed on
Jul 2, 2016
Sold by
Dweydari Steve and Dweydari Mayada
Bought by
Cruz Dana
Current Estimated Value
Home Financials for this Owner
Home Financials are based on the most recent Mortgage that was taken out on this home.
Original Mortgage
$123,190
Outstanding Balance
$100,018
Interest Rate
4.12%
Mortgage Type
New Conventional
Estimated Equity
$121,064
Purchase Details
Closed on
Jul 17, 2012
Sold by
Williams Mark D and Bank Of America
Bought by
Dweydari Steve
Purchase Details
Closed on
Jun 27, 2000
Sold by
Benard Lee A and Benard Shelonda
Bought by
Chavira Esther
Home Financials for this Owner
Home Financials are based on the most recent Mortgage that was taken out on this home.
Original Mortgage
$90,726
Interest Rate
8.55%
Mortgage Type
FHA
Purchase Details
Closed on
Jan 16, 1995
Sold by
Gyziecki Robin M
Bought by
Wade Shelonda and Benard Lee A
Home Financials for this Owner
Home Financials are based on the most recent Mortgage that was taken out on this home.
Original Mortgage
$80,573
Interest Rate
9.28%
Mortgage Type
FHA
Create a Home Valuation Report for This Property
The Home Valuation Report is an in-depth analysis detailing your home's value as well as a comparison with similar homes in the area
Home Values in the Area
Average Home Value in this Area
Purchase History
| Date | Buyer | Sale Price | Title Company |
|---|---|---|---|
| Cruz Dana | $127,000 | Chicago Title Company | |
| Dweydari Steve | -- | None Available | |
| Chavira Esther | $93,500 | Law Title | |
| Wade Shelonda | $81,000 | First American Title |
Source: Public Records
Mortgage History
| Date | Status | Borrower | Loan Amount |
|---|---|---|---|
| Open | Cruz Dana | $123,190 | |
| Previous Owner | Chavira Esther | $90,726 | |
| Previous Owner | Wade Shelonda | $80,573 |
Source: Public Records
Tax History
| Year | Tax Paid | Tax Assessment Tax Assessment Total Assessment is a certain percentage of the fair market value that is determined by local assessors to be the total taxable value of land and additions on the property. | Land | Improvement |
|---|---|---|---|---|
| 2024 | $3,981 | $60,352 | $21,256 | $39,096 |
| 2023 | $3,757 | $54,230 | $19,100 | $35,130 |
| 2022 | $3,542 | $48,240 | $16,870 | $31,370 |
| 2021 | $3,437 | $46,520 | $16,270 | $30,250 |
| 2020 | $3,479 | $46,520 | $16,270 | $30,250 |
| 2019 | $3,341 | $44,240 | $15,470 | $28,770 |
| 2018 | $2,097 | $29,740 | $10,330 | $19,410 |
| 2017 | $1,890 | $26,980 | $9,370 | $17,610 |
| 2016 | $2,258 | $24,420 | $8,480 | $15,940 |
| 2015 | $2,242 | $23,180 | $8,050 | $15,130 |
| 2014 | $2,191 | $21,990 | $7,580 | $14,410 |
| 2013 | $1,580 | $22,140 | $7,630 | $14,510 |
Source: Public Records
Map
Nearby Homes
- 1185 Norwood Ln
- 3431 Charlemaine Dr
- 1154 Brunswick Ln Unit 18B
- 3024 Long Grove Ln Unit 13B
- 1140 Brunswick Ln
- 741 Cooper Ct E Unit 20A
- 3389 Ravinia Cir
- 3467 Ravinia Cir
- 3700 Charlemaine Dr
- 913 Meadowridge Dr
- 1544 Normantown Rd Unit 395
- 3730 Baybrook Dr Unit 26
- 900 Chelsea Ct
- 3128 Quincy Ln
- 2942 Shelly Ln Unit 25
- 2891 Bar Harbour Rd
- 1335 Lawrence Ct
- 3140 Medford Ct
- 2860 Bridgeport Ln Unit 19D
- 3026 Diane Dr
- 1030 Pheasant Run Ln Unit 1030
- 1032 Pheasant Run Ln Unit 18C
- 1026 Pheasant Run Ln Unit 18C
- 1024 Pheasant Run Ln Unit 18C
- 1060 Pheasant Run Ln Unit 18C
- 1058 Pheasant Run Ln Unit 18C
- 1020 Pheasant Run Ln
- 1068 Pheasant Run Ln
- 1068 Pheasant Run Ln Unit 1068
- 1070 Pheasant Run Ln Unit 18C
- 1033 Pheasant Run Ln
- 1047 Pheasant Run Ln Unit 18C
- 1039 Pheasant Run Ln
- 1045 Pheasant Run Ln Unit 18C
- 1076 Pheasant Run Ln
- 1035 Pheasant Run Ln Unit 18C
- 1051 Pheasant Run Ln Unit 18C
- 1029 Pheasant Run Ln
- 1041 Pheasant Run Ln
- 1053 Pheasant Run Ln
Your Personal Tour Guide
Ask me questions while you tour the home.