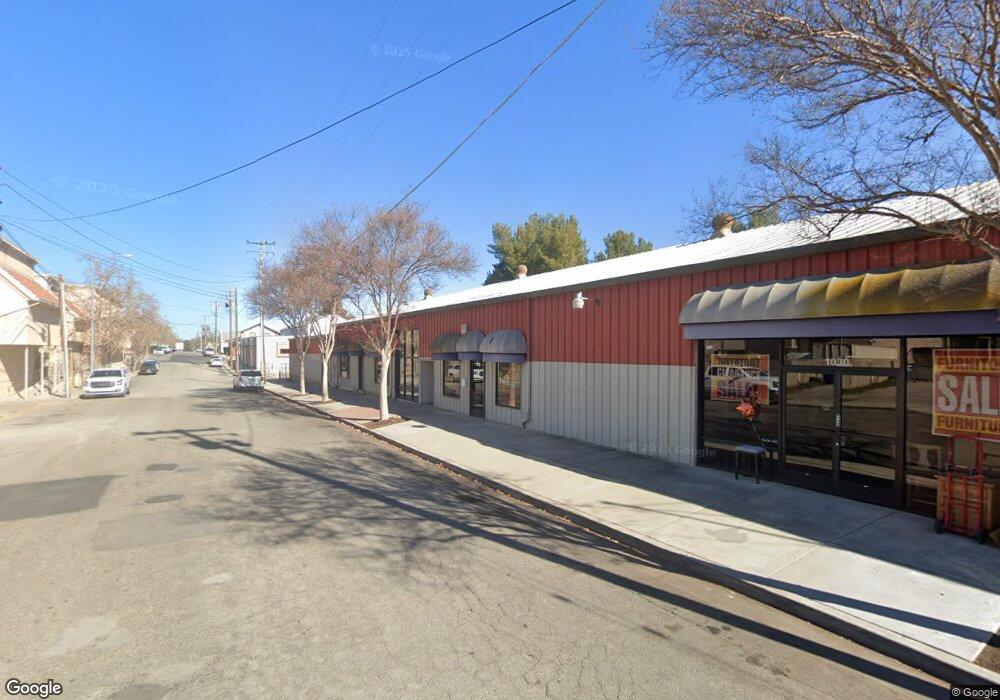
1030 Railroad St Unit 103 Paso Robles, CA 93446
Estimated Value: $1,693,226
Studio
--
Bath
928
Sq Ft
$1,825/Sq Ft
Est. Value
About This Home
This home is located at 1030 Railroad St Unit 103, Paso Robles, CA 93446 and is currently estimated at $1,693,226, approximately $1,824 per square foot. 1030 Railroad St Unit 103 is a home located in San Luis Obispo County with nearby schools including Glen Speck Elementary School, George H. Flamson Middle School, and Paso Robles High School.
Ownership History
Date
Name
Owned For
Owner Type
Purchase Details
Closed on
Mar 10, 2015
Sold by
Nielson Doris D and The Warren W Johnsen & Doris D
Bought by
Peter & Judith Felthousen Trust
Current Estimated Value
Purchase Details
Closed on
Mar 6, 2015
Sold by
Nielson Doris D
Bought by
Nielson Doris D and Johnsen Warren W
Purchase Details
Closed on
Sep 24, 2012
Sold by
Nielson Clarence William
Bought by
Nielson Doris D
Purchase Details
Closed on
May 31, 2000
Sold by
Nielson Doris D
Bought by
Nielson Clarence William
Home Financials for this Owner
Home Financials are based on the most recent Mortgage that was taken out on this home.
Original Mortgage
$150,000
Interest Rate
8.18%
Mortgage Type
Commercial
Purchase Details
Closed on
May 12, 2000
Sold by
Cako Development Corp
Bought by
Johnsen Doris J and Johnsen Warren W
Home Financials for this Owner
Home Financials are based on the most recent Mortgage that was taken out on this home.
Original Mortgage
$150,000
Interest Rate
8.18%
Mortgage Type
Commercial
Create a Home Valuation Report for This Property
The Home Valuation Report is an in-depth analysis detailing your home's value as well as a comparison with similar homes in the area
Purchase History
| Date | Buyer | Sale Price | Title Company |
|---|---|---|---|
| Peter & Judith Felthousen Trust | $925,000 | Fidelity National Title Co | |
| Nielson Doris D | -- | Accommodation | |
| Nielson Doris D | -- | None Available | |
| Nielson Doris D | -- | None Available | |
| Nielson Clarence William | -- | First American Title Ins Co | |
| Johnsen Doris J | $600,000 | First American Title Ins Co |
Source: Public Records
Mortgage History
| Date | Status | Borrower | Loan Amount |
|---|---|---|---|
| Previous Owner | Nielson Clarence William | $150,000 | |
| Previous Owner | Johnsen Doris J | $150,000 |
Source: Public Records
Tax History
| Year | Tax Paid | Tax Assessment Tax Assessment Total Assessment is a certain percentage of the fair market value that is determined by local assessors to be the total taxable value of land and additions on the property. | Land | Improvement |
|---|---|---|---|---|
| 2025 | $12,117 | $1,111,702 | $552,847 | $558,855 |
| 2024 | $11,919 | $1,089,905 | $542,007 | $547,898 |
| 2023 | $11,919 | $1,068,535 | $531,380 | $537,155 |
| 2022 | $11,742 | $1,047,584 | $520,961 | $526,623 |
| 2021 | $11,542 | $1,027,045 | $510,747 | $516,298 |
| 2020 | $11,385 | $1,016,514 | $505,510 | $511,004 |
| 2019 | $11,223 | $996,584 | $495,599 | $500,985 |
| 2018 | $11,071 | $977,044 | $485,882 | $491,162 |
| 2017 | $10,410 | $957,887 | $476,355 | $481,532 |
| 2016 | $10,206 | $939,106 | $467,015 | $472,091 |
| 2015 | $8,434 | $767,297 | $191,820 | $575,477 |
| 2014 | $8,141 | $752,268 | $188,063 | $564,205 |
Source: Public Records
Map
Nearby Homes
Your Personal Tour Guide
Ask me questions while you tour the home.