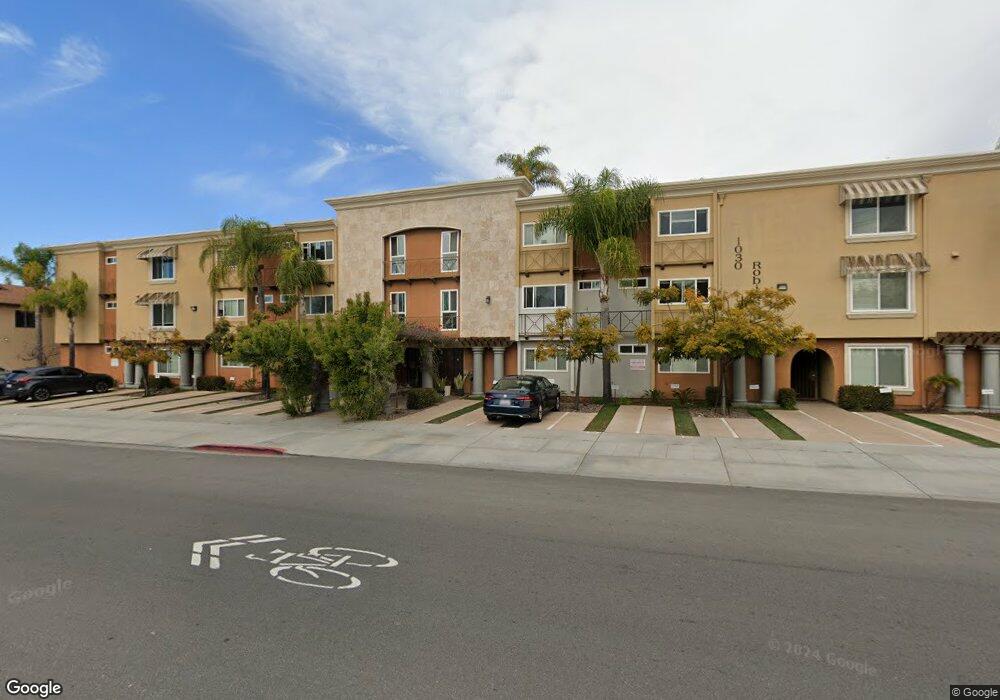
1030 Robinson Ave Unit 311 San Diego, CA 92103
Hillcrest NeighborhoodEstimated Value: $623,352 - $720,000
2
Beds
2
Baths
975
Sq Ft
$698/Sq Ft
Est. Value
About This Home
This home is located at 1030 Robinson Ave Unit 311, San Diego, CA 92103 and is currently estimated at $680,088, approximately $697 per square foot. 1030 Robinson Ave Unit 311 is a home located in San Diego County with nearby schools including Birney Elementary School, Roosevelt International Middle School, and Museum School.
Ownership History
Date
Name
Owned For
Owner Type
Purchase Details
Closed on
Oct 22, 2019
Sold by
L 20 Llc
Bought by
L 20 Llc
Current Estimated Value
Home Financials for this Owner
Home Financials are based on the most recent Mortgage that was taken out on this home.
Original Mortgage
$6,550,000
Outstanding Balance
$5,755,623
Interest Rate
3.65%
Mortgage Type
Commercial
Estimated Equity
-$5,075,535
Purchase Details
Closed on
Sep 12, 2011
Sold by
Floit Dan
Bought by
L 20 Llc
Purchase Details
Closed on
Mar 1, 2011
Sold by
1030 Robinson Owner Llc
Bought by
Floit Properties Inc
Purchase Details
Closed on
Jul 29, 2009
Sold by
1030 Robinson Owner Llc
Bought by
Floit Dan
Create a Home Valuation Report for This Property
The Home Valuation Report is an in-depth analysis detailing your home's value as well as a comparison with similar homes in the area
Home Values in the Area
Average Home Value in this Area
Purchase History
| Date | Buyer | Sale Price | Title Company |
|---|---|---|---|
| L 20 Llc | -- | Chicago Title Company | |
| L 20 Llc | -- | Chicago Title Co | |
| Floit Properties Inc | -- | None Available | |
| Floit Dan | -- | Chicago Title Co |
Source: Public Records
Mortgage History
| Date | Status | Borrower | Loan Amount |
|---|---|---|---|
| Open | L 20 Llc | $6,550,000 |
Source: Public Records
Tax History Compared to Growth
Tax History
| Year | Tax Paid | Tax Assessment Tax Assessment Total Assessment is a certain percentage of the fair market value that is determined by local assessors to be the total taxable value of land and additions on the property. | Land | Improvement |
|---|---|---|---|---|
| 2025 | $2,596 | $212,968 | $83,895 | $129,073 |
| 2024 | $2,596 | $208,793 | $82,250 | $126,543 |
| 2023 | $2,539 | $204,700 | $80,638 | $124,062 |
| 2022 | $2,471 | $200,687 | $79,057 | $121,630 |
| 2021 | $2,455 | $196,753 | $77,507 | $119,246 |
| 2020 | $2,425 | $194,737 | $76,713 | $118,024 |
| 2019 | $2,382 | $190,919 | $75,209 | $115,710 |
| 2018 | $2,229 | $187,177 | $73,735 | $113,442 |
| 2017 | $80 | $183,508 | $72,290 | $111,218 |
| 2016 | $2,141 | $179,911 | $70,873 | $109,038 |
| 2015 | $2,109 | $177,210 | $69,809 | $107,401 |
| 2014 | $2,077 | $173,740 | $68,442 | $105,298 |
Source: Public Records
Map
Nearby Homes
- 1032 Pennsylvania Ave
- 1034 Pennsylvania Ave
- 1225-37 University Ave Unit 39-42
- 1435 Essex St Unit 7
- 3709 7th Ave Unit 6
- 1271 Brookes Terrace
- 1270 Cleveland Ave Unit C131
- 1270 Cleveland Ave Unit K103
- 3967 8th Ave
- 3942 8th Ave
- 1607 1609 Robinson Ave
- 3940 7th Ave Unit 206
- 3635 7th Ave Unit 6C
- 3635 7th Ave Unit 15G
- 3635 7th Ave Unit 13E
- 3634 7th Ave Unit 1B
- 3635 7th Ave Unit 9E
- 4015 Richmond St
- 1034 Myrtle Way
- 1010 Myrtle Way
- 1030 Robinson Ave Unit 315
- 1030 Robinson Ave Unit 314
- 1030 Robinson Ave Unit 312
- 1030 Robinson Ave Unit 310
- 1030 Robinson Ave Unit 309
- 1030 Robinson Ave Unit 308
- 1030 Robinson Ave Unit 307
- 1030 Robinson Ave Unit 306
- 1030 Robinson Ave Unit 305
- 1030 Robinson Ave Unit 304
- 1030 Robinson Ave Unit 303
- 1030 Robinson Ave Unit 302
- 1030 Robinson Ave Unit 301
- 1030 Robinson Ave Unit 215
- 1030 Robinson Ave Unit 214
- 1030 Robinson Ave Unit 212
- 1030 Robinson Ave Unit 211
- 1030 Robinson Ave Unit 210
- 1030 Robinson Ave Unit 209
- 1030 Robinson Ave Unit 208