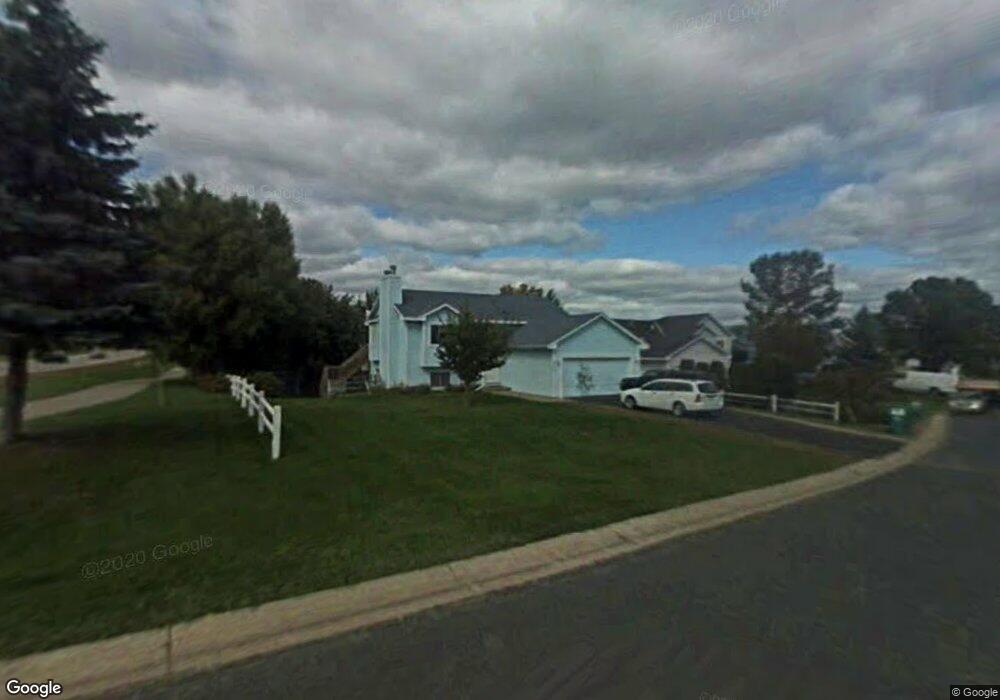
1030 Saddlebrook Trail Chanhassen, MN 55317
Estimated Value: $480,000 - $506,000
4
Beds
2
Baths
1,898
Sq Ft
$262/Sq Ft
Est. Value
About This Home
This home is located at 1030 Saddlebrook Trail, Chanhassen, MN 55317 and is currently estimated at $497,271, approximately $261 per square foot. 1030 Saddlebrook Trail is a home located in Carver County with nearby schools including Chanhassen Elementary School, Pioneer Ridge Middle School, and Chanhassen High School.
Ownership History
Date
Name
Owned For
Owner Type
Purchase Details
Closed on
Sep 2, 2022
Sold by
Lange Shane and Sinn Kristal
Bought by
Norem Anthony and Norem Jessica
Current Estimated Value
Purchase Details
Closed on
Aug 24, 2022
Sold by
Shane Lange
Bought by
Norem Anthony D and Norem Jessica A
Purchase Details
Closed on
Nov 16, 2021
Sold by
Edlund Cody J and Edlund Jenna
Bought by
Lange Shane and Lange Krista
Home Financials for this Owner
Home Financials are based on the most recent Mortgage that was taken out on this home.
Original Mortgage
$382,500
Interest Rate
2.99%
Mortgage Type
New Conventional
Purchase Details
Closed on
Nov 1, 2017
Sold by
Bateman Mary M
Bought by
Edlund Jenna and Edlund Cody J
Home Financials for this Owner
Home Financials are based on the most recent Mortgage that was taken out on this home.
Original Mortgage
$323,950
Interest Rate
3.85%
Mortgage Type
New Conventional
Create a Home Valuation Report for This Property
The Home Valuation Report is an in-depth analysis detailing your home's value as well as a comparison with similar homes in the area
Home Values in the Area
Average Home Value in this Area
Purchase History
| Date | Buyer | Sale Price | Title Company |
|---|---|---|---|
| Norem Anthony | $457,500 | -- | |
| Norem Anthony D | $457,512 | Watermark Title | |
| Lange Shane | $425,000 | Watermark Title Agency | |
| Edlund Jenna | $341,000 | Trademark Title Svcs Inc |
Source: Public Records
Mortgage History
| Date | Status | Borrower | Loan Amount |
|---|---|---|---|
| Previous Owner | Lange Shane | $382,500 | |
| Previous Owner | Edlund Jenna | $323,950 |
Source: Public Records
Tax History Compared to Growth
Tax History
| Year | Tax Paid | Tax Assessment Tax Assessment Total Assessment is a certain percentage of the fair market value that is determined by local assessors to be the total taxable value of land and additions on the property. | Land | Improvement |
|---|---|---|---|---|
| 2025 | $4,550 | $444,500 | $140,000 | $304,500 |
| 2024 | $2,234 | $438,400 | $140,000 | $298,400 |
| 2023 | $4,402 | $433,600 | $140,000 | $293,600 |
| 2022 | $4,808 | $431,300 | $139,200 | $292,100 |
| 2021 | $4,664 | $410,000 | $116,000 | $294,000 |
| 2020 | $4,726 | $405,600 | $116,000 | $289,600 |
| 2019 | $4,660 | $383,900 | $110,500 | $273,400 |
| 2018 | $3,338 | $383,900 | $110,500 | $273,400 |
| 2017 | $3,362 | $275,200 | $96,100 | $179,100 |
| 2016 | $3,536 | $256,100 | $0 | $0 |
| 2015 | $3,074 | $258,100 | $0 | $0 |
| 2014 | $3,074 | $206,600 | $0 | $0 |
Source: Public Records
Map
Nearby Homes
- 7291 Pontiac Cir
- 7104 Pontiac Cir
- 1003 Pontiac Ln
- 1042 Pontiac Ln
- 760 Bighorn Dr
- 7639 Nicholas Way
- 710 W Village Rd Unit 105
- 7719 Nicholas Way
- 7406 Laredo Dr
- 601 Fox Hill Dr
- 834 Cree Dr
- 1000 Carver Beach Rd
- 1350 Heather Ct
- 6690 Nez Perce Dr
- 5523 Game Farm Lookout
- 303 W 77th St
- 6620 Horseshoe Curve
- 7602 Erie Ave
- 6491 Bretton Way
- 970 Pleasantview Rd
- 1020 Saddlebrook Trail
- 1010 Saddlebrook Trail
- 1031 Saddlebrook Trail
- 1021 Saddlebrook Trail
- 1000 Saddlebrook Trail
- 7250 Cactus Curve
- 7260 Cactus Curve
- 990 Saddlebrook Trail
- 990 Saddlebrook Trail
- 7270 Cactus Curve
- 980 Saddlebrook Curve
- 980 Saddlebrook Curve
- 1001 Butte Ct
- 980 Saddlebrook Trail
- 980 Saddlebrook Trail
- 1021 Butte Ct
- 7280 Cactus Curve
- 1031 Butte Ct
- 1011 Butte Ct
- 1041 Butte Ct