Estimated Value: $520,000 - $571,000
3
Beds
--
Bath
2,400
Sq Ft
$227/Sq Ft
Est. Value
About This Home
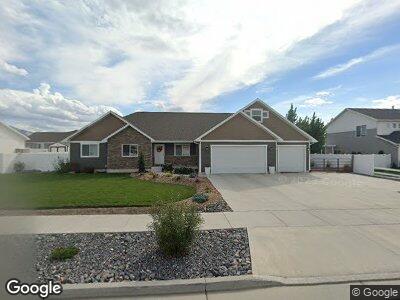
This home is located at 1030 W 2600 S, Logan, UT 84321 and is currently estimated at $545,494, approximately $227 per square foot. 1030 W 2600 S is a home with nearby schools including Nibley School, Spring Creek Middle School, and South Cache Middle School.
Ownership History
Date
Name
Owned For
Owner Type
Purchase Details
Closed on
Mar 2, 2018
Sold by
Heslop Casey B
Bought by
Heslop Casey B and Heslop Julie Laura
Current Estimated Value
Home Financials for this Owner
Home Financials are based on the most recent Mortgage that was taken out on this home.
Original Mortgage
$276,022
Interest Rate
4.04%
Mortgage Type
New Conventional
Purchase Details
Closed on
Mar 1, 2018
Sold by
Loosle K Craig and Loosle Leanne
Bought by
Heslop Casey B
Home Financials for this Owner
Home Financials are based on the most recent Mortgage that was taken out on this home.
Original Mortgage
$276,022
Interest Rate
4.04%
Mortgage Type
New Conventional
Purchase Details
Closed on
Jan 19, 2018
Sold by
Loosle Kelly C
Bought by
Loosle K Craig and Loosle Leanne
Home Financials for this Owner
Home Financials are based on the most recent Mortgage that was taken out on this home.
Original Mortgage
$276,022
Interest Rate
4.04%
Mortgage Type
New Conventional
Create a Home Valuation Report for This Property
The Home Valuation Report is an in-depth analysis detailing your home's value as well as a comparison with similar homes in the area
Home Values in the Area
Average Home Value in this Area
Purchase History
| Date | Buyer | Sale Price | Title Company |
|---|---|---|---|
| Heslop Casey B | -- | Heritage Title | |
| Heslop Casey B | -- | Heritage Title | |
| Loosle K Craig | -- | -- |
Source: Public Records
Mortgage History
| Date | Status | Borrower | Loan Amount |
|---|---|---|---|
| Open | Hesdlop Casey B | $273,600 | |
| Closed | Heslop Casey B | $276,022 |
Source: Public Records
Tax History Compared to Growth
Tax History
| Year | Tax Paid | Tax Assessment Tax Assessment Total Assessment is a certain percentage of the fair market value that is determined by local assessors to be the total taxable value of land and additions on the property. | Land | Improvement |
|---|---|---|---|---|
| 2024 | $2,539 | $315,940 | $0 | $0 |
| 2023 | $2,688 | $313,225 | $0 | $0 |
| 2022 | $2,798 | $313,225 | $0 | $0 |
| 2021 | $1,907 | $331,580 | $68,000 | $263,580 |
| 2020 | $1,795 | $297,200 | $68,000 | $229,200 |
| 2019 | $1,883 | $297,200 | $68,000 | $229,200 |
| 2018 | $1,631 | $251,200 | $60,000 | $191,200 |
Source: Public Records
Map
Nearby Homes
- 2658 S 1060 W
- 1065 W 2740 S
- 2783 S 1100 W
- 2689 S 800 W
- 2814 S 1150 W
- 3074 S 800 W
- 1249 W 2350 S
- 2251 S 1120 W Unit 56
- 2243 S 1120 W Unit 58
- 2205 S 1120 W Unit 62
- 1389 W 2870 S
- 3298 S 1000 W
- 2174 S 1450 W
- 1460 W 3045 S
- 1469 W 2200 S
- 2124 S 1490 W
- 3291 S 1000 W
- 1444 W 2055 S
- 1177 W 1960 S
- 2225 S 1600 W