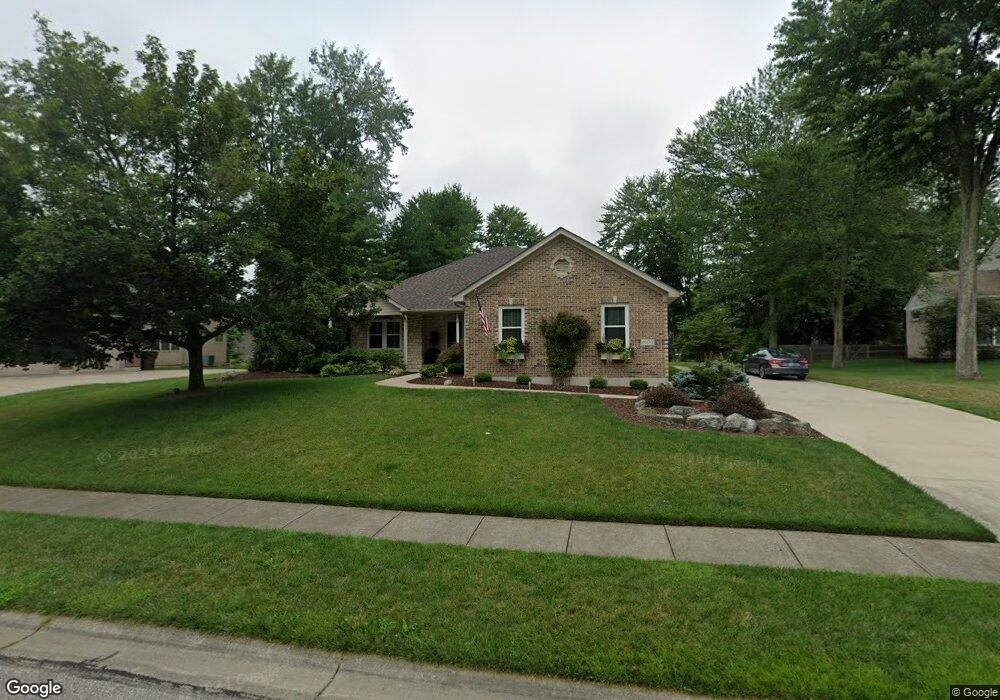
1030 Windsor Ct Unit 50 Cincinnati, OH 45245
Estimated Value: $430,000 - $508,000
3
Beds
2
Baths
2,057
Sq Ft
$225/Sq Ft
Est. Value
About This Home
This home is located at 1030 Windsor Ct Unit 50, Cincinnati, OH 45245 and is currently estimated at $463,007, approximately $225 per square foot. 1030 Windsor Ct Unit 50 is a home located in Clermont County with nearby schools including Clough Pike Elementary School, West Clermont Middle School, and West Clermont High School.
Ownership History
Date
Name
Owned For
Owner Type
Purchase Details
Closed on
Jul 3, 2020
Sold by
Wilson Pamela
Bought by
Kamphaus Susan M and Kamphaus Don
Current Estimated Value
Home Financials for this Owner
Home Financials are based on the most recent Mortgage that was taken out on this home.
Original Mortgage
$287,900
Outstanding Balance
$255,291
Interest Rate
3.1%
Mortgage Type
New Conventional
Estimated Equity
$207,716
Purchase Details
Closed on
Mar 4, 2005
Sold by
Gorman Chris and Gorman Audrey
Bought by
Wilson Robert and Wilson Pamela
Purchase Details
Closed on
Sep 12, 2001
Sold by
Deval Inc
Bought by
Gorman Chris and Gorman Audrey
Home Financials for this Owner
Home Financials are based on the most recent Mortgage that was taken out on this home.
Original Mortgage
$172,000
Interest Rate
7.03%
Mortgage Type
Balloon
Purchase Details
Closed on
Jul 9, 1999
Sold by
Chanticleer Properties L
Bought by
Deval Inc
Create a Home Valuation Report for This Property
The Home Valuation Report is an in-depth analysis detailing your home's value as well as a comparison with similar homes in the area
Home Values in the Area
Average Home Value in this Area
Purchase History
| Date | Buyer | Sale Price | Title Company |
|---|---|---|---|
| Kamphaus Susan M | $319,900 | Mattingly Ford Ttl Svcs Llc | |
| Wilson Robert | $245,000 | -- | |
| Gorman Chris | $39,000 | -- | |
| Deval Inc | $162,500 | -- |
Source: Public Records
Mortgage History
| Date | Status | Borrower | Loan Amount |
|---|---|---|---|
| Open | Kamphaus Susan M | $287,900 | |
| Previous Owner | Gorman Chris | $172,000 |
Source: Public Records
Tax History Compared to Growth
Tax History
| Year | Tax Paid | Tax Assessment Tax Assessment Total Assessment is a certain percentage of the fair market value that is determined by local assessors to be the total taxable value of land and additions on the property. | Land | Improvement |
|---|---|---|---|---|
| 2024 | $6,558 | $129,260 | $25,520 | $103,740 |
| 2023 | $6,568 | $129,260 | $25,520 | $103,740 |
| 2022 | $5,308 | $90,410 | $17,850 | $72,560 |
| 2021 | $5,330 | $90,410 | $17,850 | $72,560 |
| 2020 | $5,335 | $90,410 | $17,850 | $72,560 |
| 2019 | $4,236 | $83,760 | $15,440 | $68,320 |
| 2018 | $4,279 | $83,760 | $15,440 | $68,320 |
| 2017 | $4,037 | $83,760 | $15,440 | $68,320 |
| 2016 | $4,077 | $72,210 | $13,300 | $58,910 |
| 2015 | $3,919 | $72,210 | $13,300 | $58,910 |
| 2014 | $3,917 | $72,210 | $13,300 | $58,910 |
| 2013 | $4,101 | $74,800 | $14,000 | $60,800 |
Source: Public Records
Map
Nearby Homes
- 1069 Crisfield Dr
- 1051 Crisfield Dr
- 1079 Kensington Ln
- 4271 Wellington Dr
- 4310 Wuebold Ln
- 4250 English Oaks Ct
- 1097 Stone Oak Blvd
- 4279 Larma Ln
- 4225 English Oaks Ct
- 1105 Ridgepointe Dr
- 4237 N Yorkshire Square
- 4152 S Gensen Loop
- 4125 Beamer Ct
- 246 R Bridgewater Dr
- 4165 S Gensen Loop
- 4450 Schoolhouse Rd
- 4103 Roland Creek Dr
- 1204 Cedar Run Ct
- 1364 Grandstand Ln
- 1194 Meadow Knoll Ct
- 1030 Windsor Ct
- 1026 Windsor Ct
- 1026 Windsor Ct Unit 49
- 1034 Windsor Ct
- 4312 Wellington Dr
- 4308 Wellington Dr
- 1014 Windsor Ct
- 1014 Windsor Ct Unit 48
- 1029 Windsor Ct Unit 55
- 1031 Windsor Ct
- 4316 Wellington Dr
- 1035 Windsor Ct
- 1025 Windsor Ct
- 1025 Windsor Ct Unit 56
- 1033 Windsor Ct
- 1021 Windsor Ct
- 4319 Wellington Dr
- 4319 Wellington Dr Unit 43
- 4311 Wellington Dr
- 4311 Wellington Dr Unit 41