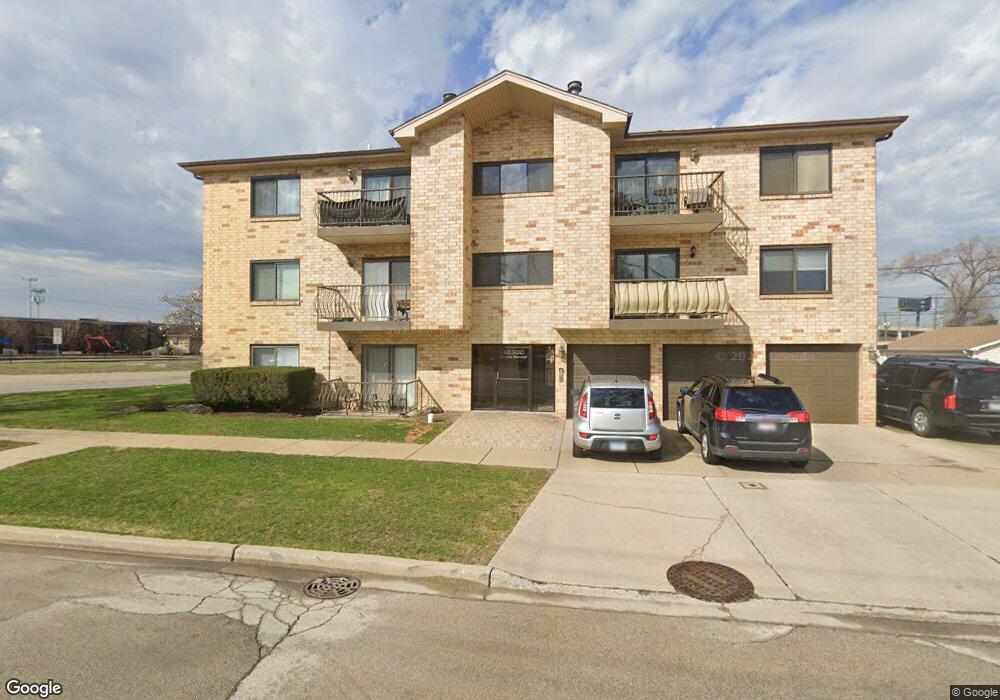
10300 Front Ave Unit 3 Franklin Park, IL 60131
Estimated Value: $198,000 - $209,828
2
Beds
2
Baths
974
Sq Ft
$211/Sq Ft
Est. Value
About This Home
This home is located at 10300 Front Ave Unit 3, Franklin Park, IL 60131 and is currently estimated at $205,207, approximately $210 per square foot. 10300 Front Ave Unit 3 is a home located in Cook County with nearby schools including Scott Elementary School, Mannheim Middle School, and East Leyden High School.
Ownership History
Date
Name
Owned For
Owner Type
Purchase Details
Closed on
May 24, 2004
Sold by
Rollins Christopher
Bought by
Escamilla Juan M
Current Estimated Value
Home Financials for this Owner
Home Financials are based on the most recent Mortgage that was taken out on this home.
Original Mortgage
$168,500
Outstanding Balance
$76,885
Interest Rate
5.12%
Mortgage Type
Unknown
Estimated Equity
$128,322
Purchase Details
Closed on
Sep 18, 2002
Sold by
Rollins Jeanette K
Bought by
Rollins Christopher
Home Financials for this Owner
Home Financials are based on the most recent Mortgage that was taken out on this home.
Original Mortgage
$70,000
Interest Rate
7.5%
Purchase Details
Closed on
Oct 17, 2000
Sold by
Parkway Bank & Trust Company
Bought by
Rollins Jeanette K
Home Financials for this Owner
Home Financials are based on the most recent Mortgage that was taken out on this home.
Original Mortgage
$60,000
Interest Rate
8.25%
Create a Home Valuation Report for This Property
The Home Valuation Report is an in-depth analysis detailing your home's value as well as a comparison with similar homes in the area
Home Values in the Area
Average Home Value in this Area
Purchase History
| Date | Buyer | Sale Price | Title Company |
|---|---|---|---|
| Escamilla Juan M | $177,500 | Heritage Title Company | |
| Rollins Christopher | -- | -- | |
| Rollins Jeanette K | $130,000 | -- |
Source: Public Records
Mortgage History
| Date | Status | Borrower | Loan Amount |
|---|---|---|---|
| Open | Escamilla Juan M | $168,500 | |
| Previous Owner | Rollins Christopher | $70,000 | |
| Previous Owner | Rollins Jeanette K | $60,000 |
Source: Public Records
Tax History Compared to Growth
Tax History
| Year | Tax Paid | Tax Assessment Tax Assessment Total Assessment is a certain percentage of the fair market value that is determined by local assessors to be the total taxable value of land and additions on the property. | Land | Improvement |
|---|---|---|---|---|
| 2024 | $3,127 | $12,990 | $1,240 | $11,750 |
| 2023 | $3,046 | $12,990 | $1,240 | $11,750 |
| 2022 | $3,046 | $12,990 | $1,240 | $11,750 |
| 2021 | $2,357 | $9,501 | $895 | $8,606 |
| 2020 | $2,424 | $9,501 | $895 | $8,606 |
| 2019 | $2,552 | $10,730 | $895 | $9,835 |
| 2018 | $3,940 | $13,413 | $757 | $12,656 |
| 2017 | $3,943 | $13,413 | $757 | $12,656 |
| 2016 | $4,013 | $13,413 | $757 | $12,656 |
| 2015 | $3,468 | $11,548 | $689 | $10,859 |
| 2014 | $3,420 | $11,548 | $689 | $10,859 |
| 2013 | $3,267 | $11,548 | $689 | $10,859 |
Source: Public Records
Map
Nearby Homes
- 3522 George St
- 3535 Ernst St
- 3516 Dora St
- 10330 Addison Ave
- 3507 Louis St
- 3515 Louis St
- 3519 Louis St
- 3652 Hawthorne St
- 3623 Hawthorne St
- 3137 Sunset Ln
- 3421 Elder Ln
- 3046 Sarah St
- 3037 Bright St
- 3709 Emerson St
- 4001 Denley Ave
- 3706 Ruby St
- 3321 Ruby St
- 4034 Denley Ave
- 3821 Emerson Dr
- 10542 Crown Rd
- 10300 Front Ave Unit 2
- 10300 Front Ave Unit 4
- 10300 Front Ave Unit 1
- 10300 Front Ave Unit 5
- 10300 Front St Unit 3N
- 10300 Front St Unit 3S
- 10300 Front Ave Unit 2N
- 10300 Front Ave Unit 3S
- 3510 Ernst St
- 10314 Front Ave
- 10314 Front Ave
- 3501 Ernst St
- 3505 Ernst St
- 10324 Front Ave
- 3507 Ernst St
- 3512 Ernst St
- 3509 Ernst St
- 10265 Pacific Ave
- 3516 Ernst St
- 3511 Ernst St