Estimated Value: $633,000 - $966,000
3
Beds
2
Baths
1,623
Sq Ft
$495/Sq Ft
Est. Value
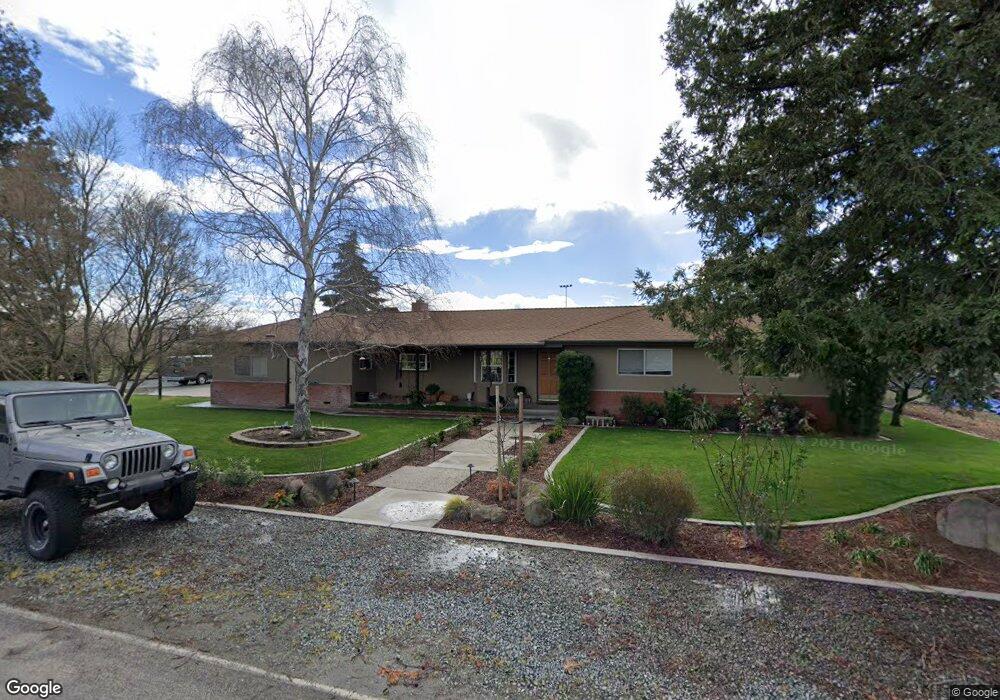
About This Home
This home is located at 10300 Lyons Rd, Ripon, CA 95366 and is currently estimated at $803,327, approximately $494 per square foot. 10300 Lyons Rd is a home located in San Joaquin County with nearby schools including Ripon Elementary School, Weston Elementary School, and Ripona Elementary School.
Ownership History
Date
Name
Owned For
Owner Type
Purchase Details
Closed on
Apr 9, 2004
Sold by
Nizzoli Regina L
Bought by
Nizzoli Regina L
Current Estimated Value
Home Financials for this Owner
Home Financials are based on the most recent Mortgage that was taken out on this home.
Original Mortgage
$401,250
Outstanding Balance
$186,081
Interest Rate
5.56%
Mortgage Type
Stand Alone First
Estimated Equity
$617,246
Purchase Details
Closed on
Mar 24, 2004
Sold by
Nizzoli Curt
Bought by
Nizzoli Regina L
Home Financials for this Owner
Home Financials are based on the most recent Mortgage that was taken out on this home.
Original Mortgage
$401,250
Outstanding Balance
$186,081
Interest Rate
5.56%
Mortgage Type
Stand Alone First
Estimated Equity
$617,246
Purchase Details
Closed on
Jun 30, 2000
Sold by
Shipley Barbara Ann
Bought by
Barton Rachel and Barton Mary Anne
Create a Home Valuation Report for This Property
The Home Valuation Report is an in-depth analysis detailing your home's value as well as a comparison with similar homes in the area
Purchase History
| Date | Buyer | Sale Price | Title Company |
|---|---|---|---|
| Nizzoli Regina L | -- | -- | |
| Nizzoli Regina L | -- | Old Republic Title Co | |
| Nizzoli Regina L | $535,000 | Old Republic Title Co | |
| Barton Rachel | $273,000 | Chicago Title Co |
Source: Public Records
Mortgage History
| Date | Status | Borrower | Loan Amount |
|---|---|---|---|
| Open | Nizzoli Regina L | $401,250 |
Source: Public Records
Tax History
| Year | Tax Paid | Tax Assessment Tax Assessment Total Assessment is a certain percentage of the fair market value that is determined by local assessors to be the total taxable value of land and additions on the property. | Land | Improvement |
|---|---|---|---|---|
| 2025 | $4,578 | $411,339 | $150,673 | $260,666 |
| 2024 | $4,494 | $403,274 | $147,719 | $255,555 |
| 2023 | $4,388 | $395,368 | $144,823 | $250,545 |
| 2022 | $4,320 | $387,617 | $141,984 | $245,633 |
| 2021 | $4,254 | $380,017 | $139,200 | $240,817 |
| 2020 | $4,216 | $376,121 | $137,773 | $238,348 |
| 2019 | $4,145 | $368,747 | $135,072 | $233,675 |
| 2018 | $4,082 | $361,518 | $132,424 | $229,094 |
| 2017 | $4,004 | $354,430 | $129,828 | $224,602 |
| 2016 | $3,938 | $347,483 | $127,283 | $220,200 |
| 2014 | $3,734 | $335,563 | $122,917 | $212,646 |
Source: Public Records
Map
Nearby Homes
- 23346 S Frederick Rd
- 1187 S Mohler Rd
- 1191 S Mohler Rd
- 602 S Highland Ave
- 336 Kristen Way
- 1080 Ruess Rd
- 1691 Davis St
- 1672 Bailey Dr
- 1621 Davis St
- 1601 Stanley Dr
- 1122 Zumstein Ct
- 23811 S Jack Tone Rd
- 924 Kingery Dr
- 138 Roxie Ct
- 1315 Augusta Pointe Dr
- 3037 Palm Ave Unit 105
- 637 Rebekah Ct
- 22022 99 Frontage Rd
- 663 Clay Way
- 547 Sepp Ct
- 10202 Lyons Rd
- 24801 S Austin Rd
- 10199 Lyons Rd
- 24633 S Austin Rd
- 10055 Lyons Rd
- 24975 S Austin Rd
- 9936 Lyons Rd
- 25002 S Austin Rd
- 9935 Lyons Rd
- 25145 S Austin Rd
- 24389 S Austin Rd
- 25120 S Austin Rd
- 24400 S Austin Rd
- 24360 S Austin Rd
- 25423 S Austin Rd
- 10101 Hutchinson Rd
- 25400 S Austin Rd
- 10068 W Ripon Rd
- 10800 W Ripon Rd Unit E
- 10858 W Ripon Rd
Your Personal Tour Guide
Ask me questions while you tour the home.