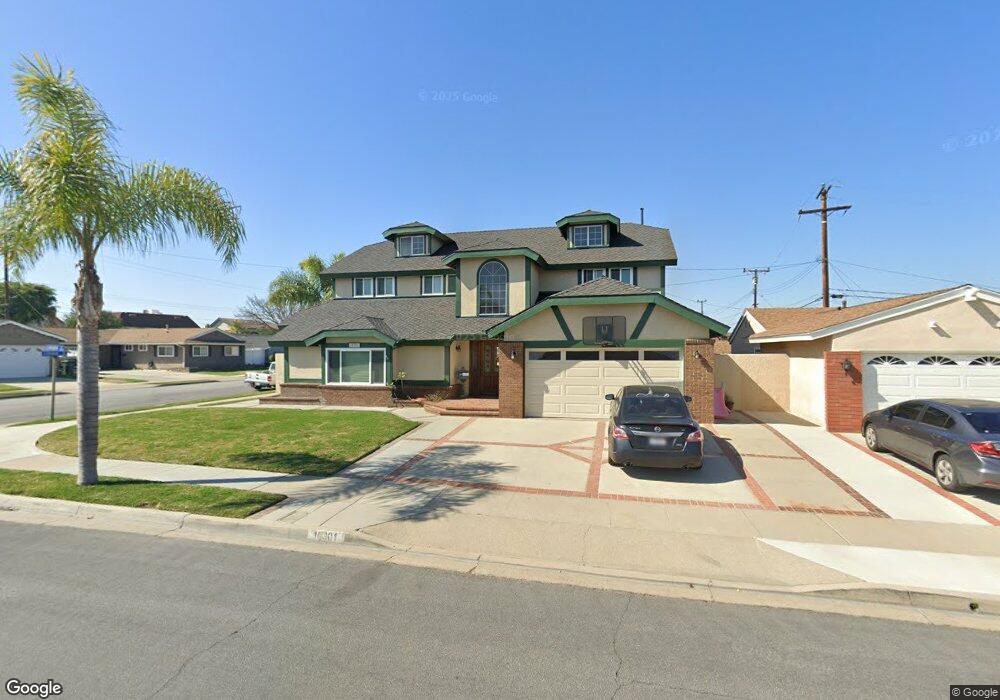
10301 Longden St Cypress, CA 90630
Estimated Value: $1,531,000 - $1,919,000
7
Beds
4
Baths
3,959
Sq Ft
$432/Sq Ft
Est. Value
About This Home
This home is located at 10301 Longden St, Cypress, CA 90630 and is currently estimated at $1,708,753, approximately $431 per square foot. 10301 Longden St is a home located in Orange County with nearby schools including Juliet Morris Elementary School, Lexington Junior High School, and Cypress High School.
Ownership History
Date
Name
Owned For
Owner Type
Purchase Details
Closed on
Apr 10, 2015
Sold by
Schmitz Danny A
Bought by
Schmitz Family Trust
Current Estimated Value
Purchase Details
Closed on
Mar 16, 1994
Sold by
Schmitz Becky A
Bought by
Schmitz Danny A
Home Financials for this Owner
Home Financials are based on the most recent Mortgage that was taken out on this home.
Original Mortgage
$203,150
Interest Rate
7.21%
Create a Home Valuation Report for This Property
The Home Valuation Report is an in-depth analysis detailing your home's value as well as a comparison with similar homes in the area
Home Values in the Area
Average Home Value in this Area
Purchase History
We collect this data history from publicly available records. To have your information removed, we recommend requesting removal directly through your county’s website.
| Date | Buyer | Sale Price | Title Company |
|---|---|---|---|
| Schmitz Family Trust | -- | None Available | |
| Schmitz Danny A | -- | Fidelity National Title Ins |
Source: Public Records
Mortgage History
We collect this data history from publicly available records. To have your information removed, we recommend requesting removal directly through your county’s website.
| Date | Status | Borrower | Loan Amount |
|---|---|---|---|
| Previous Owner | Schmitz Danny A | $203,150 |
Source: Public Records
Tax History
| Year | Tax Paid | Tax Assessment Tax Assessment Total Assessment is a certain percentage of the fair market value that is determined by local assessors to be the total taxable value of land and additions on the property. | Land | Improvement |
|---|---|---|---|---|
| 2025 | $7,060 | $633,579 | $260,172 | $373,407 |
| 2024 | $7,060 | $621,156 | $255,070 | $366,086 |
| 2023 | $6,899 | $608,977 | $250,069 | $358,908 |
| 2022 | $6,819 | $597,037 | $245,166 | $351,871 |
| 2021 | $6,729 | $585,331 | $240,359 | $344,972 |
| 2020 | $6,702 | $579,330 | $237,895 | $341,435 |
| 2019 | $6,512 | $567,971 | $233,230 | $334,741 |
| 2018 | $6,423 | $556,835 | $228,657 | $328,178 |
| 2017 | $6,201 | $545,917 | $224,173 | $321,744 |
| 2016 | $6,148 | $535,213 | $219,777 | $315,436 |
| 2015 | $6,104 | $527,174 | $216,476 | $310,698 |
| 2014 | $5,777 | $516,848 | $212,236 | $304,612 |
Source: Public Records
Map
Nearby Homes
- 5109 Saratoga Ave
- 5089 Saratoga Ave
- 5101 Myra Ave
- 5332 Belle Ave
- 5541 Marcella Ave
- 10301 Triple Crown Ln
- 10518 Triple Crown Ln
- 5353 Cumberland Dr
- 5619 Ball Rd
- 8762 8764 La Salle
- 5102 Canterbury Dr
- 130 Tierra Ln
- 160 Tierra Ln
- 170 Tierra Ln
- 4681 Larwin Ave
- 10902 Flora Park Way
- 10866 Rojo Ct
- 5258 Hanover Dr
- 4607 Amarillo Ct
- 10948 Carrillo Ct
- 10291 Longden St
- 5181 Citation Ave
- 10281 Longden St
- 5202 Citation Ave
- 5182 Marion Ave
- 5171 Citation Ave
- 5182 Citation Ave
- 10302 Longden St
- 10332 Longden St
- 10292 Longden St
- 5172 Citation Ave
- 5172 Marion Ave
- 10342 Longden St
- 5161 Citation Ave
- 10282 Longden St
- 5162 Citation Ave
- 10371 Longden St
- 10362 Longden St
- 5162 Marion Ave
- 10301 Ponder St
Your Personal Tour Guide
Ask me questions while you tour the home.