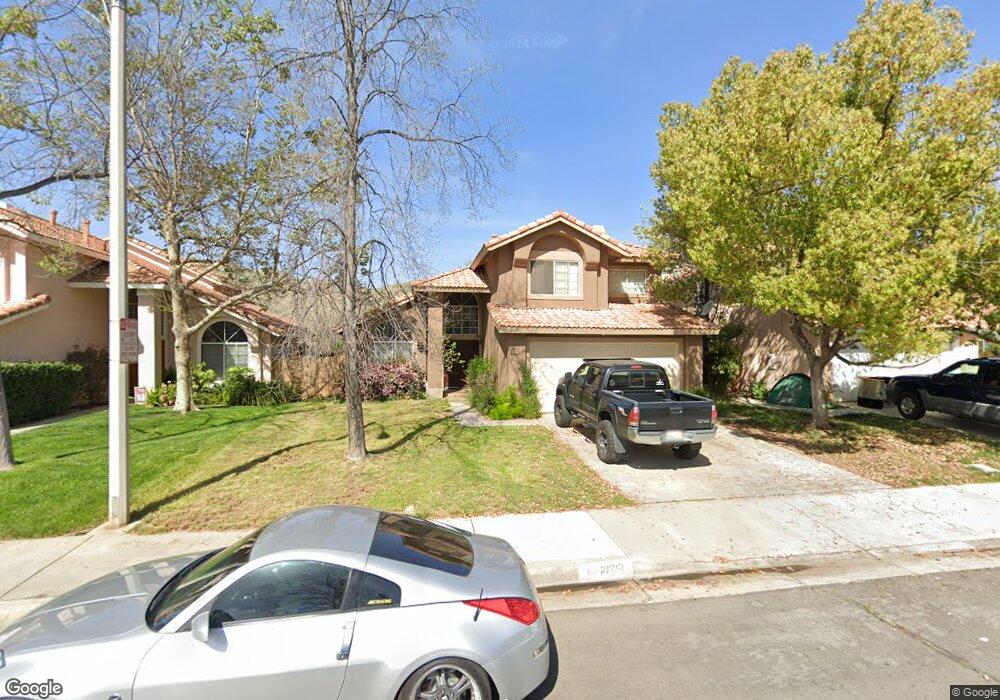
10301 Via Apolina Moreno Valley, CA 92557
Hidden Springs NeighborhoodEstimated Value: $442,000 - $566,000
4
Beds
3
Baths
1,783
Sq Ft
$294/Sq Ft
Est. Value
About This Home
This home is located at 10301 Via Apolina, Moreno Valley, CA 92557 and is currently estimated at $523,448, approximately $293 per square foot. 10301 Via Apolina is a home located in Riverside County with nearby schools including Hidden Springs Elementary School, Vista Heights Middle School, and Canyon Springs High School.
Ownership History
Date
Name
Owned For
Owner Type
Purchase Details
Closed on
Aug 23, 2001
Sold by
Delreal Ernesto
Bought by
Campos Pablo and Campos Marisol
Current Estimated Value
Home Financials for this Owner
Home Financials are based on the most recent Mortgage that was taken out on this home.
Original Mortgage
$162,500
Interest Rate
6.84%
Purchase Details
Closed on
Apr 12, 2000
Sold by
Adams Regina L
Bought by
Campos Pablo and Campos Marisol
Home Financials for this Owner
Home Financials are based on the most recent Mortgage that was taken out on this home.
Original Mortgage
$120,000
Interest Rate
9%
Purchase Details
Closed on
Oct 20, 1993
Sold by
Federal National Mortgage Association
Bought by
Adams Regina L
Home Financials for this Owner
Home Financials are based on the most recent Mortgage that was taken out on this home.
Original Mortgage
$124,578
Interest Rate
6.91%
Mortgage Type
FHA
Create a Home Valuation Report for This Property
The Home Valuation Report is an in-depth analysis detailing your home's value as well as a comparison with similar homes in the area
Home Values in the Area
Average Home Value in this Area
Purchase History
| Date | Buyer | Sale Price | Title Company |
|---|---|---|---|
| Campos Pablo | -- | Northern Counties | |
| Campos Pablo | $36,000 | Fidelity National Title Co | |
| Adams Regina L | $125,000 | Commonwealth Land Title Co |
Source: Public Records
Mortgage History
| Date | Status | Borrower | Loan Amount |
|---|---|---|---|
| Closed | Campos Pablo | $162,500 | |
| Previous Owner | Campos Pablo | $120,000 | |
| Previous Owner | Adams Regina L | $124,578 | |
| Closed | Campos Pablo | $30,000 |
Source: Public Records
Tax History Compared to Growth
Tax History
| Year | Tax Paid | Tax Assessment Tax Assessment Total Assessment is a certain percentage of the fair market value that is determined by local assessors to be the total taxable value of land and additions on the property. | Land | Improvement |
|---|---|---|---|---|
| 2025 | $2,609 | $230,512 | $38,405 | $192,107 |
| 2023 | $2,609 | $221,563 | $36,914 | $184,649 |
| 2022 | $2,509 | $217,220 | $36,191 | $181,029 |
| 2021 | $2,462 | $212,962 | $35,482 | $177,480 |
| 2020 | $2,435 | $210,780 | $35,119 | $175,661 |
| 2019 | $2,394 | $206,648 | $34,431 | $172,217 |
| 2018 | $2,347 | $202,597 | $33,757 | $168,840 |
| 2017 | $2,295 | $198,626 | $33,096 | $165,530 |
| 2016 | $2,271 | $194,733 | $32,448 | $162,285 |
| 2015 | $2,238 | $191,810 | $31,961 | $159,849 |
| 2014 | $2,085 | $188,055 | $31,336 | $156,719 |
Source: Public Records
Map
Nearby Homes
- 10189 Via Apolina
- 10228 Via Pavon
- 0 Cantarini Rd Unit 219045579
- 0 Box Springs Rd Unit CV25064688
- 10201 Coral Ln
- 10299 Kite Ct
- 10449 Nighthawk Ct
- 10459 Nighthawk Ct
- O Samuel Way
- 23426 Mariner Way
- 10086 Deville Dr
- 10546 Sparrow Ct
- 10641 Breezy Meadow Dr
- 10685 Ridgefield Terrace
- 23614 Tonada Ln
- 23759 Heliotrope Way
- 22792 Springdale Dr
- 23638 Airosa Place
- 23752 Timber Bluff Ct
- 10991 Mendoza Rd
- 10293 Via Apolina
- 10309 Via Apolina
- 10319 Kite Ct
- 10312 Penguin Ct
- 10344 Sanderling Ct
- 10302 Penguin Ct
- 10320 Kite Ct
- 10285 Via Apolina
- 10317 Via Apolina
- 10277 Via Apolina
- 10325 Via Apolina
- 10308 Via Apolina
- 10300 Via Apolina
- 10316 Via Apolina
- 10292 Via Apolina
- 10269 Via Apolina
- 10345 Via Apolina
- 10340 Via Apolina
- 10293 Via Pastoral
- 10301 Via Pastoral