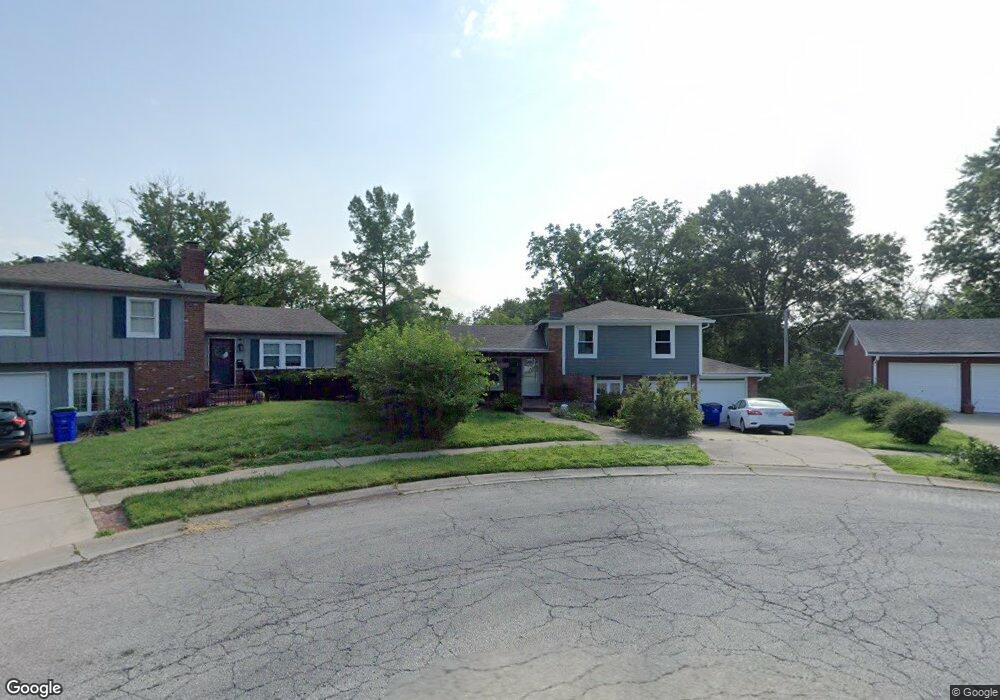
10301 W 67th Terrace Shawnee, KS 66203
Estimated Value: $296,000 - $321,000
3
Beds
2
Baths
1,102
Sq Ft
$281/Sq Ft
Est. Value
About This Home
This home is located at 10301 W 67th Terrace, Shawnee, KS 66203 and is currently estimated at $310,212, approximately $281 per square foot. 10301 W 67th Terrace is a home located in Johnson County with nearby schools including Nieman Elementary School, Hocker Grove Middle School, and Shawnee Mission North High School.
Ownership History
Date
Name
Owned For
Owner Type
Purchase Details
Closed on
Mar 6, 2019
Sold by
Courtney Mark J
Bought by
Courtney Mark J and Courtney Minghui
Current Estimated Value
Purchase Details
Closed on
Dec 12, 2016
Sold by
Jones Megan L
Bought by
Courtney Mark J
Purchase Details
Closed on
Jan 6, 2009
Sold by
Schmiedeler Schmiedeler David David and Schmiedeler Louis P
Bought by
Jones Megan L and Courtney Mark J
Home Financials for this Owner
Home Financials are based on the most recent Mortgage that was taken out on this home.
Original Mortgage
$129,600
Interest Rate
5.99%
Mortgage Type
Purchase Money Mortgage
Purchase Details
Closed on
Feb 8, 2008
Sold by
Schmiedeler Louis P and Schmiedeler Shirley E
Bought by
Schmiedeler Louis R and Schmiedeler David
Create a Home Valuation Report for This Property
The Home Valuation Report is an in-depth analysis detailing your home's value as well as a comparison with similar homes in the area
Home Values in the Area
Average Home Value in this Area
Purchase History
| Date | Buyer | Sale Price | Title Company |
|---|---|---|---|
| Courtney Mark J | -- | None Available | |
| Courtney Mark J | -- | None Available | |
| Jones Megan L | -- | Chicago Title Ins Co Olathe | |
| Schmiedeler Louis R | -- | None Available |
Source: Public Records
Mortgage History
| Date | Status | Borrower | Loan Amount |
|---|---|---|---|
| Previous Owner | Jones Megan L | $129,600 |
Source: Public Records
Tax History Compared to Growth
Tax History
| Year | Tax Paid | Tax Assessment Tax Assessment Total Assessment is a certain percentage of the fair market value that is determined by local assessors to be the total taxable value of land and additions on the property. | Land | Improvement |
|---|---|---|---|---|
| 2024 | $3,348 | $31,832 | $5,924 | $25,908 |
| 2023 | $3,252 | $30,383 | $5,924 | $24,459 |
| 2022 | $2,934 | $27,313 | $5,159 | $22,154 |
| 2021 | $2,773 | $24,127 | $4,480 | $19,647 |
| 2020 | $2,483 | $21,298 | $4,074 | $17,224 |
| 2019 | $2,363 | $20,252 | $3,541 | $16,711 |
| 2018 | $2,196 | $18,734 | $3,226 | $15,508 |
| 2017 | $2,250 | $18,906 | $3,226 | $15,680 |
| 2016 | $2,018 | $16,721 | $3,226 | $13,495 |
| 2015 | $1,930 | $16,698 | $3,226 | $13,472 |
| 2013 | -- | $15,882 | $3,226 | $12,656 |
Source: Public Records
Map
Nearby Homes
- 10924 W 67th St
- 10235 W 70th St
- 10024 W 70th Terrace
- 6420 Ballentine St
- 10406 W 71st Place
- 9906 Edelweiss Cir
- 10914 W 71st St
- 10152 Edelweiss Cir
- 10236 Edelweiss Cir
- 11217 W 69th Terrace
- 10902 W 71st Place
- 10314 W 73rd St
- 7240 Mastin St
- 7226 Edgewood Blvd
- 6901 Grandview St
- 11406 W 71st St
- 7219 Reeder St
- 11637 W 68th Terrace
- 7410 Stearns St
- 7425 Melrose Ln
- 10302 W 67th Terrace
- 10305 W 67th Terrace
- 6708 Mastin St
- 6712 Mastin St
- 6704 Mastin St
- 10306 W 67th Terrace
- 10309 W 67th Terrace
- 6800 Mastin St
- 10311 W 67th St
- 6700 Mastin St
- 10310 W 67th Terrace
- 6735 Switzer Ln
- 6804 Mastin St
- 10315 W 67th St
- 6727 Switzer Ln
- 6739 Switzer Ln
- 10100 W 68th St
- 10103 W 68th St
- 6705 Mastin St
- 10319 W 67th St