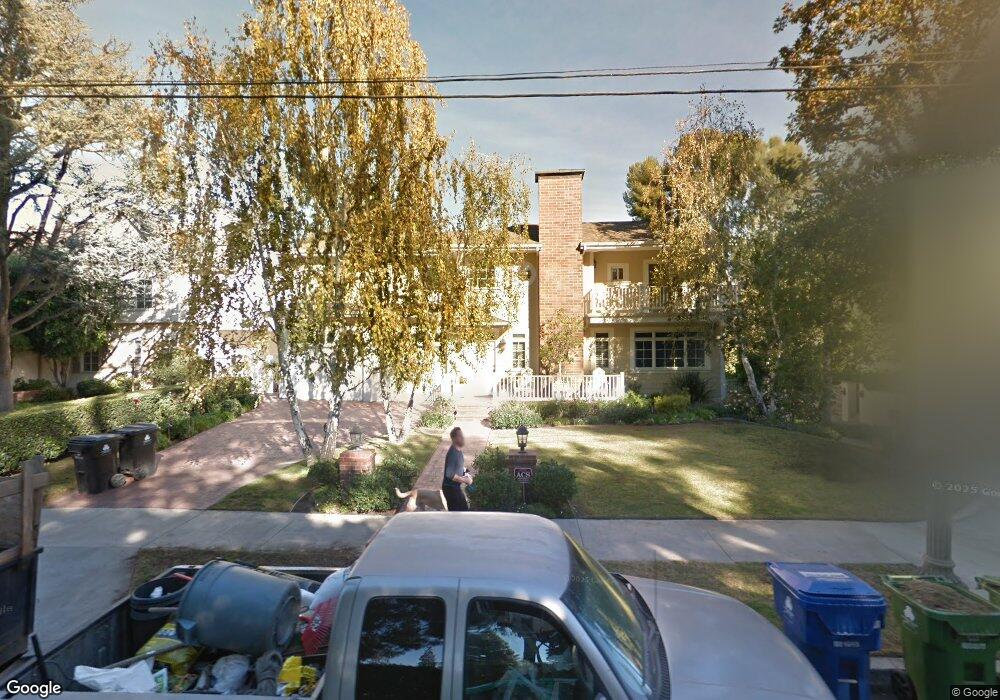
10303 Valley Spring Ln Toluca Lake, CA 91602
Estimated Value: $4,146,647 - $4,547,000
6
Beds
6
Baths
5,390
Sq Ft
$797/Sq Ft
Est. Value
About This Home
This home is located at 10303 Valley Spring Ln, Toluca Lake, CA 91602 and is currently estimated at $4,295,216, approximately $796 per square foot. 10303 Valley Spring Ln is a home located in Los Angeles County with nearby schools including Rio Vista Elementary, Walter Reed Middle, and East Valley Senior High School.
Ownership History
Date
Name
Owned For
Owner Type
Purchase Details
Closed on
Apr 2, 1998
Sold by
Marinelli Leah and The Leah Marinelli Living Trus
Bought by
Italia Carmen and Italia Robin T
Current Estimated Value
Home Financials for this Owner
Home Financials are based on the most recent Mortgage that was taken out on this home.
Original Mortgage
$1,293,750
Interest Rate
6.75%
Purchase Details
Closed on
Feb 21, 1997
Sold by
Marinelli Leah
Bought by
Marinelli Leah and Leah Marinelli Living Trust
Purchase Details
Closed on
Jan 24, 1997
Sold by
Valley Spring Llc
Bought by
Marinelli Leah
Purchase Details
Closed on
Jan 21, 1997
Sold by
Mitchell Gloria C and Valley Spring Llc
Bought by
Valley Spring Llc
Purchase Details
Closed on
Mar 22, 1994
Sold by
Carbone Gloria and Carbone Mitchell
Bought by
Mitchell Gloria Carbone
Create a Home Valuation Report for This Property
The Home Valuation Report is an in-depth analysis detailing your home's value as well as a comparison with similar homes in the area
Home Values in the Area
Average Home Value in this Area
Purchase History
| Date | Buyer | Sale Price | Title Company |
|---|---|---|---|
| Italia Carmen | $1,725,000 | Southland Title Corporation | |
| Marinelli Leah | -- | -- | |
| Marinelli Leah | $400,000 | Progressive Title Company | |
| Valley Spring Llc | $342,000 | Progressive Title Company | |
| Mitchell Gloria Carbone | -- | -- |
Source: Public Records
Mortgage History
| Date | Status | Borrower | Loan Amount |
|---|---|---|---|
| Previous Owner | Italia Carmen | $1,293,750 |
Source: Public Records
Tax History Compared to Growth
Tax History
| Year | Tax Paid | Tax Assessment Tax Assessment Total Assessment is a certain percentage of the fair market value that is determined by local assessors to be the total taxable value of land and additions on the property. | Land | Improvement |
|---|---|---|---|---|
| 2025 | $33,288 | $2,776,353 | $1,157,654 | $1,618,699 |
| 2024 | $33,288 | $2,721,915 | $1,134,955 | $1,586,960 |
| 2023 | $32,640 | $2,668,545 | $1,112,701 | $1,555,844 |
| 2022 | $31,118 | $2,616,222 | $1,090,884 | $1,525,338 |
| 2021 | $30,727 | $2,564,925 | $1,069,495 | $1,495,430 |
| 2020 | $31,042 | $2,538,626 | $1,058,529 | $1,480,097 |
| 2019 | $29,803 | $2,488,850 | $1,037,774 | $1,451,076 |
| 2018 | $29,644 | $2,440,050 | $1,017,426 | $1,422,624 |
| 2016 | $28,328 | $2,345,302 | $977,919 | $1,367,383 |
| 2015 | $27,912 | $2,310,074 | $963,230 | $1,346,844 |
| 2014 | $27,988 | $2,264,824 | $944,362 | $1,320,462 |
Source: Public Records
Map
Nearby Homes
- 10445 Valley Spring Ln
- 4331 Talofa Ave
- 4345 Talofa Ave
- 4402 Ledge Ave
- 4427 Arcola Ave
- 10441 Bloomfield St
- 4433 Arcola Ave
- 10352 Riverside Dr Unit 102
- 10352 Riverside Dr Unit 201
- 4310 Cahuenga Blvd Unit 304
- 10530 Moorpark St
- 10409 Riverside Dr Unit 203
- 10458 Riverside Dr
- 4359 Clybourn Ave
- 4426 Auckland Ave
- 4406 Cahuenga Blvd
- 4547 Ledge Ave
- 10602 Landale St
- 4544 Talofa Ave
- 112 S Valley St
- 10311 Valley Spring Ln
- 10259 Valley Spring Ln
- 10323 Valley Spring Ln
- 10322 Whipple St
- 10317 Valley Spring Ln
- 10253 Valley Spring Ln
- 4270 Arcola Ave
- 10303 Whipple St
- 10331 Valley Spring Ln
- 10247 Valley Spring Ln
- 10317 Whipple St
- 10330 Whipple St
- 10241 Valley Spring Ln
- 4262 Arcola Ave
- 10337 Valley Spring Ln
- 10329 Whipple St
- 0 Arcola Ave
- 0 Arcola Ave Unit 13-714397
- 10336 Whipple St
- 10333 Whipple St