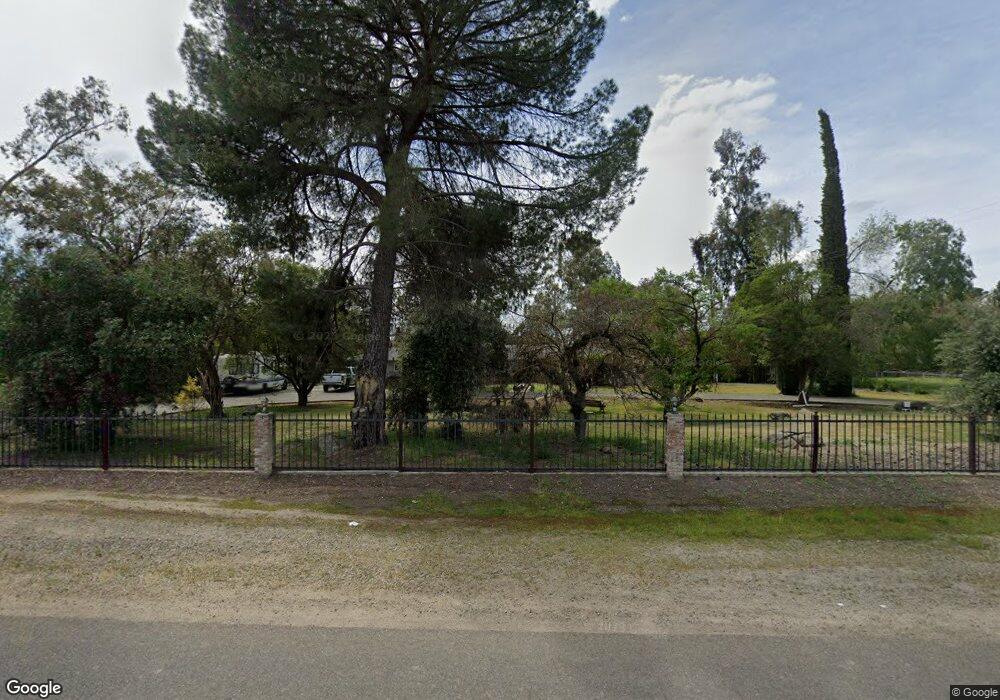
10305 N Fowler Ave Clovis, CA 93619
Estimated Value: $629,408 - $740,000
3
Beds
3
Baths
2,020
Sq Ft
$331/Sq Ft
Est. Value
About This Home
This home is located at 10305 N Fowler Ave, Clovis, CA 93619 and is currently estimated at $669,469, approximately $331 per square foot. 10305 N Fowler Ave is a home located in Fresno County with nearby schools including Riverview Elementary School, Granite Ridge Intermediate School, and Clovis North High School.
Ownership History
Date
Name
Owned For
Owner Type
Purchase Details
Closed on
Mar 25, 2013
Sold by
Leslie William A
Bought by
Leslie William A
Current Estimated Value
Home Financials for this Owner
Home Financials are based on the most recent Mortgage that was taken out on this home.
Original Mortgage
$251,170
Outstanding Balance
$177,003
Interest Rate
3.51%
Mortgage Type
New Conventional
Estimated Equity
$492,466
Purchase Details
Closed on
Apr 18, 2008
Sold by
Leslie Diana M
Bought by
Leslie William A
Home Financials for this Owner
Home Financials are based on the most recent Mortgage that was taken out on this home.
Original Mortgage
$263,000
Interest Rate
6.11%
Mortgage Type
New Conventional
Purchase Details
Closed on
Oct 27, 1997
Sold by
Blazenski Joseph R and Blazenski Jean Doris
Bought by
Leslie William A and Leslie Diana M
Home Financials for this Owner
Home Financials are based on the most recent Mortgage that was taken out on this home.
Original Mortgage
$128,000
Interest Rate
7.33%
Create a Home Valuation Report for This Property
The Home Valuation Report is an in-depth analysis detailing your home's value as well as a comparison with similar homes in the area
Purchase History
| Date | Buyer | Sale Price | Title Company |
|---|---|---|---|
| Leslie William A | -- | Orange Coast Title | |
| Leslie William A | -- | North American Title Company | |
| Leslie William A | $158,000 | First American Title Ins Co |
Source: Public Records
Mortgage History
| Date | Status | Borrower | Loan Amount |
|---|---|---|---|
| Open | Leslie William A | $251,170 | |
| Closed | Leslie William A | $263,000 | |
| Closed | Leslie William A | $128,000 |
Source: Public Records
Tax History
| Year | Tax Paid | Tax Assessment Tax Assessment Total Assessment is a certain percentage of the fair market value that is determined by local assessors to be the total taxable value of land and additions on the property. | Land | Improvement |
|---|---|---|---|---|
| 2025 | $3,359 | $283,890 | $79,824 | $204,066 |
| 2023 | $3,232 | $272,868 | $76,725 | $196,143 |
| 2022 | $3,189 | $267,519 | $75,221 | $192,298 |
| 2021 | $3,100 | $262,275 | $73,747 | $188,528 |
| 2020 | $3,088 | $259,586 | $72,991 | $186,595 |
| 2019 | $3,028 | $254,497 | $71,560 | $182,937 |
| 2018 | $2,962 | $249,507 | $70,157 | $179,350 |
| 2017 | $2,912 | $244,616 | $68,782 | $175,834 |
| 2016 | $2,813 | $239,821 | $67,434 | $172,387 |
| 2015 | $2,770 | $236,220 | $66,422 | $169,798 |
| 2014 | $2,719 | $231,593 | $65,121 | $166,472 |
Source: Public Records
Map
Nearby Homes
- 10326 N Fowler Ave
- 5180 E Copper Ave
- 4890 E Copper Ave
- 1685 Heirloom Ave
- 1675 Heirloom Ave
- 2492 N Harken Way
- 1655 Heirloom Ave
- 2460 N Harken Way
- 1684 Heirloom Ave
- 6391 E Copper Ave
- 0 E Copper Ave
- 2291 N Argyle Ave
- 2283 N Argyle Ave
- 2262 N Marion Ave
- 1059 Springtime Ave
- 1053 Springtime Ave
- 1052 Springtime Ave
- 2231 N Marion Ave
- 1046 Springtime Ave
- 1528 Vintage Ln
- 10285 N Fowler Ave
- 10347 N Fowler Ave
- 10328 N Fowler Ave
- 10381 N Fowler Ave
- 10280 N Fowler Ave
- 10253 N Fowler Ave
- 10258 N Fowler Ave
- 10398 N Fowler Ave
- 10239 N Fowler Ave
- 10216 N Fowler Ave
- 5333 E International Ave
- 10194 N Fowler Ave
- 5415 E International Ave
- 10460 N Fowler Ave
- 10277 N Fowler Ave
- 10161 N Fowler Ave
- 5555 E International Ave
- 5334 E International Ave
- 10131 N Fowler Ave
- 5615 E International Ave
Your Personal Tour Guide
Ask me questions while you tour the home.