Estimated Value: $1,065,000 - $1,237,000
3
Beds
2
Baths
1,700
Sq Ft
$681/Sq Ft
Est. Value
About This Home
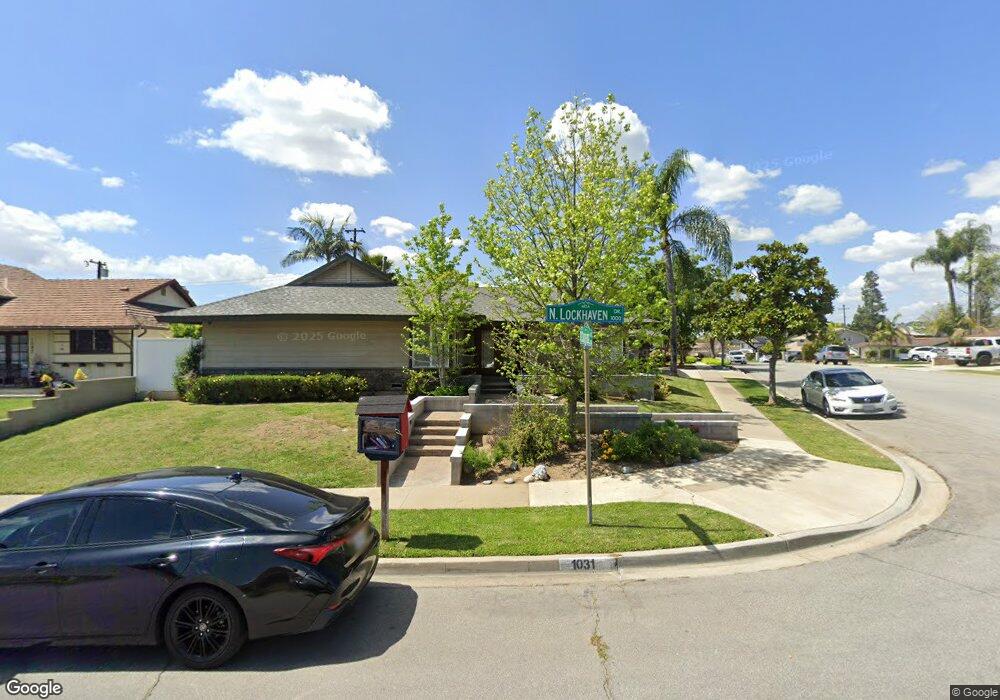
This home is located at 1031 Lockhaven Dr, Brea, CA 92821 and is currently estimated at $1,158,070, approximately $681 per square foot. 1031 Lockhaven Dr is a home located in Orange County with nearby schools including Sierra Vista Elementary School, Ladera Palma Elementary School, and Washington Middle School.
Ownership History
Date
Name
Owned For
Owner Type
Purchase Details
Closed on
Aug 10, 2024
Sold by
Fraijo Matthew C and Fraijo Sandra E
Bought by
Matthew And Sandra Fraijo Revocable Living Tr and Fraijo
Current Estimated Value
Purchase Details
Closed on
Mar 22, 2002
Sold by
Dandrea Fred J and Dandrea Greta
Bought by
Fraijo Matthew and Fraijo Sandra
Home Financials for this Owner
Home Financials are based on the most recent Mortgage that was taken out on this home.
Original Mortgage
$279,200
Interest Rate
6.87%
Purchase Details
Closed on
Mar 17, 1997
Sold by
Cabrera Kenneth
Bought by
Dandrea Fred J and Dandrea Greta
Purchase Details
Closed on
May 14, 1996
Sold by
Stahl William G and Stahl Margaret L
Bought by
Dandrea Fred J and Dandrea Greta
Home Financials for this Owner
Home Financials are based on the most recent Mortgage that was taken out on this home.
Original Mortgage
$198,000
Interest Rate
8.3%
Create a Home Valuation Report for This Property
The Home Valuation Report is an in-depth analysis detailing your home's value as well as a comparison with similar homes in the area
Home Values in the Area
Average Home Value in this Area
Purchase History
| Date | Buyer | Sale Price | Title Company |
|---|---|---|---|
| Matthew And Sandra Fraijo Revocable Living Tr | -- | None Listed On Document | |
| Fraijo Matthew | $349,000 | First American Title Co | |
| Dandrea Fred J | -- | -- | |
| Dandrea Fred J | $220,000 | North American Title Co |
Source: Public Records
Mortgage History
| Date | Status | Borrower | Loan Amount |
|---|---|---|---|
| Previous Owner | Fraijo Matthew | $279,200 | |
| Previous Owner | Dandrea Fred J | $198,000 |
Source: Public Records
Tax History
| Year | Tax Paid | Tax Assessment Tax Assessment Total Assessment is a certain percentage of the fair market value that is determined by local assessors to be the total taxable value of land and additions on the property. | Land | Improvement |
|---|---|---|---|---|
| 2025 | $6,816 | $586,290 | $386,214 | $200,076 |
| 2024 | $6,816 | $574,795 | $378,642 | $196,153 |
| 2023 | $6,660 | $563,525 | $371,218 | $192,307 |
| 2022 | $6,589 | $552,476 | $363,939 | $188,537 |
| 2021 | $6,480 | $541,644 | $356,803 | $184,841 |
| 2020 | $6,418 | $536,091 | $353,145 | $182,946 |
| 2019 | $6,239 | $525,580 | $346,221 | $179,359 |
| 2018 | $6,132 | $515,275 | $339,432 | $175,843 |
| 2017 | $6,020 | $505,172 | $332,776 | $172,396 |
| 2016 | $5,876 | $495,267 | $326,251 | $169,016 |
| 2015 | $5,709 | $487,828 | $321,350 | $166,478 |
| 2014 | $5,541 | $478,273 | $315,056 | $163,217 |
Source: Public Records
Map
Nearby Homes
- 900 De Jur St
- 1401 Havenhurst Dr
- 1011 Delay St
- 1142 Delay St
- 1508 Mccart Ave
- 530 Palermo Way
- 1020 Joyce Dr
- 736 Knoll Lake Dr Unit 266
- 908 Tracie Dr
- 1414 W Central Ave Unit 10
- 470 N Palm St
- 655 Wood Lake Dr Unit 190
- 1585 Honeywood Ct
- 846 Mooncrest Cir
- 1633 Gatewood Ct
- 740 Laura St
- 1663 Gatewood Ct
- 598 Elkwood Ct
- 1362 Fern Lake Ave Unit 113
- 856 Williams St
- 1027 Lockhaven Dr
- 1308 Southridge Dr
- 1311 Walling Ave
- 1021 Lockhaven Dr
- 1314 Southridge Dr
- 1030 Lockhaven Dr
- 1101 Lockhaven Dr
- 1309 Walling Ave
- 1026 Lockhaven Dr
- 1309 Southridge Dr
- 1100 Lockhaven Dr
- 1315 Walling Ave
- 1015 Lockhaven Dr
- 1318 Southridge Dr
- 1020 Lockhaven Dr
- 1315 Southridge Dr
- 1106 Lockhaven Dr
- 1033 N Puente St
- 1307 Walling Ave
- 1300 Rutledge Place
Your Personal Tour Guide
Ask me questions while you tour the home.