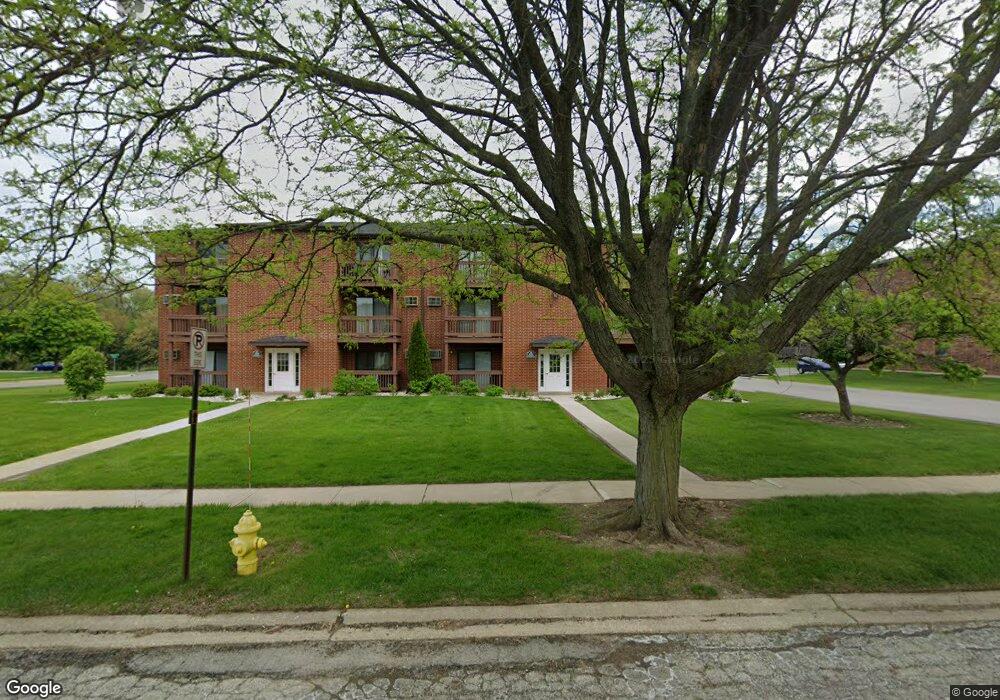
1031 Spruce St Unit 1A Glendale Heights, IL 60139
Estimated Value: $166,000 - $187,000
2
Beds
1
Bath
817
Sq Ft
$216/Sq Ft
Est. Value
About This Home
This home is located at 1031 Spruce St Unit 1A, Glendale Heights, IL 60139 and is currently estimated at $176,618, approximately $216 per square foot. 1031 Spruce St Unit 1A is a home located in DuPage County with nearby schools including Churchill Elementary School, Hadley Junior High School, and Glenbard West High School.
Ownership History
Date
Name
Owned For
Owner Type
Purchase Details
Closed on
Oct 10, 2017
Sold by
Regions Bank
Bought by
Zaidi Alamdar
Current Estimated Value
Purchase Details
Closed on
Aug 22, 2017
Sold by
Ideal Enterprises Inc
Bought by
Regions Bank and Trust Number 90 P015 00
Purchase Details
Closed on
Oct 4, 2003
Sold by
Testamentary Nevarez Maria Trinidad and Testamentary Porfirio Mendoza
Bought by
Mendoza Delilah Morales
Purchase Details
Closed on
Jan 14, 2003
Sold by
Erl Mary Ann and Estate Of Judith A Erl
Bought by
Testamentary Nevarez Maria Trinidad and Porfirio Mendoza Testamentary Trust
Purchase Details
Closed on
Oct 16, 1995
Sold by
Nitz Joseph H and Nitz Janet G
Bought by
Erl Judith A
Home Financials for this Owner
Home Financials are based on the most recent Mortgage that was taken out on this home.
Original Mortgage
$45,000
Interest Rate
7.68%
Create a Home Valuation Report for This Property
The Home Valuation Report is an in-depth analysis detailing your home's value as well as a comparison with similar homes in the area
Home Values in the Area
Average Home Value in this Area
Purchase History
| Date | Buyer | Sale Price | Title Company |
|---|---|---|---|
| Zaidi Alamdar | $65,500 | Chicago Title | |
| Regions Bank | $14,500 | None Available | |
| Mendoza Delilah Morales | -- | -- | |
| Testamentary Nevarez Maria Trinidad | $97,000 | Ticor | |
| Erl Judith A | $71,000 | Intercounty Title |
Source: Public Records
Mortgage History
| Date | Status | Borrower | Loan Amount |
|---|---|---|---|
| Previous Owner | Erl Judith A | $45,000 |
Source: Public Records
Tax History Compared to Growth
Tax History
| Year | Tax Paid | Tax Assessment Tax Assessment Total Assessment is a certain percentage of the fair market value that is determined by local assessors to be the total taxable value of land and additions on the property. | Land | Improvement |
|---|---|---|---|---|
| 2024 | $3,640 | $43,488 | $3,107 | $40,381 |
| 2023 | $2,834 | $40,030 | $2,860 | $37,170 |
| 2022 | $3,043 | $34,110 | $2,710 | $31,400 |
| 2021 | $1,970 | $27,300 | $2,170 | $25,130 |
| 2020 | $2,233 | $25,210 | $2,150 | $23,060 |
| 2019 | $2,185 | $24,540 | $2,090 | $22,450 |
| 2018 | $1,873 | $20,240 | $1,960 | $18,280 |
| 2017 | $1,571 | $16,320 | $1,580 | $14,740 |
| 2016 | $1,603 | $15,670 | $1,520 | $14,150 |
| 2015 | $1,610 | $14,950 | $1,450 | $13,500 |
| 2014 | $1,700 | $15,440 | $1,500 | $13,940 |
| 2013 | $3,533 | $33,640 | $3,250 | $30,390 |
Source: Public Records
Map
Nearby Homes
- 1002 Spruce St Unit 1B
- 1002 Spruce St Unit 2B
- 277 Shorewood Dr Unit 2A
- 267 Shorewood Dr Unit GB
- 266 Shorewood Dr Unit 1
- 256 Shorewood Dr Unit 2C
- 242 Shorewood Dr Unit 1B
- 222 Shorewood Dr Unit GD
- 1111 Bloomingdale Rd Unit 1A
- 1N713 Evergreen Ave
- 1160 Cedar St Unit 3A
- 1092 Camden Ct Unit 245
- 1N450 Highland Ave
- 23W570 Pine Dr
- 1246 Prairie Ave Unit A
- 2N162 Mildred Ave
- 1148 Harbor Ct Unit 152
- 471 Stagecoach Run
- 1188 Harbor Ct Unit 136
- 419 Sidney Ave Unit C
- 1033 Spruce St Unit 1A
- 1033 Spruce St Unit 2A
- 1033 Spruce St Unit 3A
- 1033 Spruce St Unit 2B
- 1033 Spruce St Unit 1B
- 1031 Spruce St Unit 3B
- 1031 Spruce St Unit 3A
- 1031 Spruce St Unit 1B
- 1033 Spruce St Unit 3B
- 1031 Spruce St Unit 2B
- 1031 Spruce St Unit 2A
- 1003 Spruce St Unit 3B
- 1003 Spruce St Unit 1B
- 1003 Spruce St Unit 2B
- 1003 Spruce St Unit 2A
- 1003 Spruce St Unit 3A
- 1003 Spruce St Unit 1A
- 1048 Evergreen Cir Unit 15
- 1001 Spruce St Unit 1B
- 1001 Spruce St Unit 3A