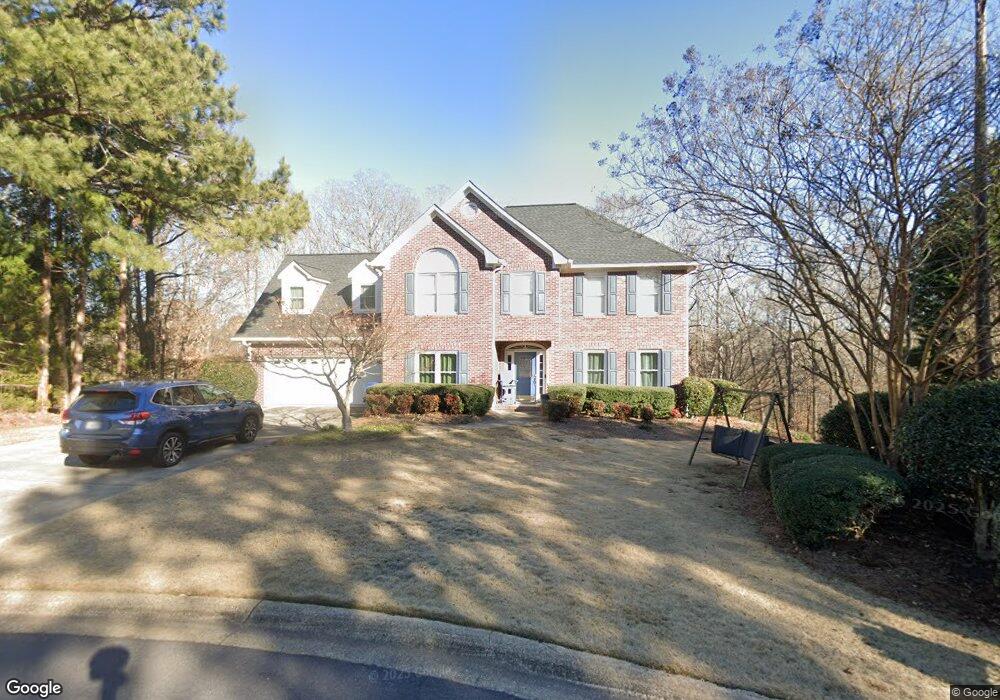
1031 Sylvia Ct Athens, GA 30606
Estimated Value: $596,000 - $770,000
4
Beds
5
Baths
2,848
Sq Ft
$232/Sq Ft
Est. Value
About This Home
This home is located at 1031 Sylvia Ct, Athens, GA 30606 and is currently estimated at $660,377, approximately $231 per square foot. 1031 Sylvia Ct is a home located in Oconee County with nearby schools including Oconee County Elementary School, Oconee County Primary School, and Oconee County Middle School.
Ownership History
Date
Name
Owned For
Owner Type
Purchase Details
Closed on
Oct 24, 2003
Sold by
Cendant Mobility Financial Cor
Bought by
Finley James P
Current Estimated Value
Purchase Details
Closed on
May 29, 1997
Sold by
Sosbee Construction
Bought by
Offik Michael W and Offik L
Create a Home Valuation Report for This Property
The Home Valuation Report is an in-depth analysis detailing your home's value as well as a comparison with similar homes in the area
Home Values in the Area
Average Home Value in this Area
Purchase History
| Date | Buyer | Sale Price | Title Company |
|---|---|---|---|
| Finley James P | $290,000 | -- | |
| Cendant Mobility Financial Corp | $293,500 | -- | |
| Offik Michael W | $256,400 | -- |
Source: Public Records
Tax History Compared to Growth
Tax History
| Year | Tax Paid | Tax Assessment Tax Assessment Total Assessment is a certain percentage of the fair market value that is determined by local assessors to be the total taxable value of land and additions on the property. | Land | Improvement |
|---|---|---|---|---|
| 2024 | $3,424 | $193,122 | $30,000 | $163,122 |
| 2023 | $3,607 | $176,996 | $26,000 | $150,996 |
| 2022 | $3,404 | $158,983 | $26,000 | $132,983 |
| 2021 | $3,216 | $139,377 | $24,000 | $115,377 |
| 2020 | $3,204 | $138,650 | $24,000 | $114,650 |
| 2019 | $2,968 | $128,461 | $24,000 | $104,461 |
| 2018 | $2,853 | $120,921 | $24,000 | $96,921 |
| 2017 | $2,745 | $116,350 | $24,000 | $92,350 |
| 2016 | $2,730 | $115,728 | $24,000 | $91,728 |
| 2015 | $2,741 | $115,974 | $24,000 | $91,974 |
| 2014 | $2,713 | $112,230 | $24,000 | $88,230 |
| 2013 | -- | $109,094 | $24,000 | $85,094 |
Source: Public Records
Map
Nearby Homes
- 1050 Chestnut Glen
- 1010 Springview Ct
- 1621 Daniells Bridge Rd
- 1011 Magnolia Dr
- 1340 Old Epps Bridge Rd
- 1231 Founders Lake Dr
- 2481 Lakewood Manor Dr
- 1271 Daniells Bridge Rd
- 1080 Barber Creek Dr
- 1091 Barber Creek Dr
- 1051 Riverhaven Ln
- 3065 Meadow Springs Dr
- 1020 Barber Creek Dr Unit 211
- 165 Canterbury Dr
- 1220 Twelve Oaks Cir
- 1191 Arrowhead Rd
- 160 Edgewood Dr
- 8420 Macon Hwy