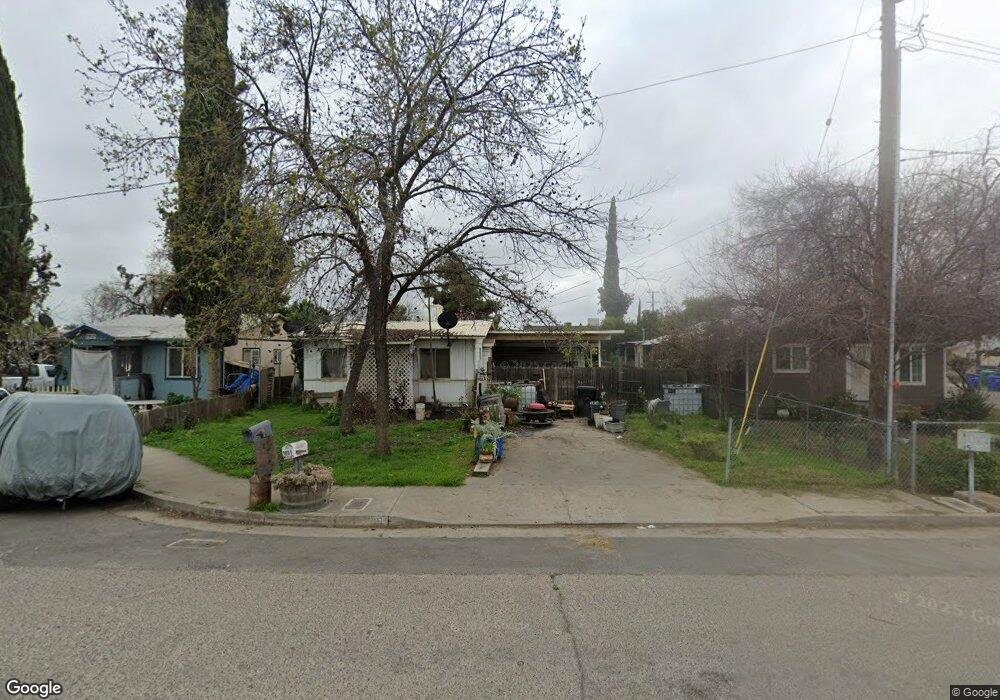
1031 W Grand Ave Porterville, CA 93257
Porterville Northwest NeighborhoodEstimated Value: $197,810 - $259,000
2
Beds
1
Bath
830
Sq Ft
$282/Sq Ft
Est. Value
About This Home
This home is located at 1031 W Grand Ave, Porterville, CA 93257 and is currently estimated at $234,453, approximately $282 per square foot. 1031 W Grand Ave is a home located in Tulare County with nearby schools including West Putnam Elementary School, Sequoia Middle School, and Monache High School.
Ownership History
Date
Name
Owned For
Owner Type
Purchase Details
Closed on
Dec 20, 2005
Sold by
Chadwell Gregory Lee
Bought by
Chadwell Gregory Lee and The Living Trust Of Olin Louise Chadwell
Current Estimated Value
Home Financials for this Owner
Home Financials are based on the most recent Mortgage that was taken out on this home.
Original Mortgage
$94,250
Interest Rate
6.36%
Mortgage Type
New Conventional
Purchase Details
Closed on
Mar 10, 2004
Sold by
Chadwell Gregory Lee
Bought by
Chadwell Gregory Lee and The Living Trust Of Olin Louise Chadwell
Home Financials for this Owner
Home Financials are based on the most recent Mortgage that was taken out on this home.
Original Mortgage
$60,775
Interest Rate
6.99%
Mortgage Type
New Conventional
Purchase Details
Closed on
Oct 26, 1999
Sold by
Chadwell Olin Louis
Bought by
Living Trust Of Olin Louis Chadwell
Create a Home Valuation Report for This Property
The Home Valuation Report is an in-depth analysis detailing your home's value as well as a comparison with similar homes in the area
Home Values in the Area
Average Home Value in this Area
Purchase History
| Date | Buyer | Sale Price | Title Company |
|---|---|---|---|
| Chadwell Gregory Lee | -- | Transnation Title Southland | |
| Chadwell Gregory Lee | -- | Transnation Title Southland | |
| Chadwell Gregory Lee | -- | Fidelity National Title | |
| Chadwell Gregory Lee | -- | Fidelity National Title | |
| Living Trust Of Olin Louis Chadwell | -- | -- |
Source: Public Records
Mortgage History
| Date | Status | Borrower | Loan Amount |
|---|---|---|---|
| Closed | Chadwell Gregory Lee | $94,250 | |
| Closed | Chadwell Gregory Lee | $60,775 |
Source: Public Records
Tax History Compared to Growth
Tax History
| Year | Tax Paid | Tax Assessment Tax Assessment Total Assessment is a certain percentage of the fair market value that is determined by local assessors to be the total taxable value of land and additions on the property. | Land | Improvement |
|---|---|---|---|---|
| 2025 | $495 | $53,774 | $10,393 | $43,381 |
| 2024 | $495 | $52,721 | $10,190 | $42,531 |
| 2023 | $493 | $51,689 | $9,991 | $41,698 |
| 2022 | $477 | $50,677 | $9,796 | $40,881 |
| 2021 | $469 | $49,683 | $9,604 | $40,079 |
| 2020 | $464 | $49,174 | $9,506 | $39,668 |
| 2019 | $454 | $48,210 | $9,320 | $38,890 |
| 2018 | $444 | $47,264 | $9,137 | $38,127 |
| 2017 | $432 | $46,337 | $8,958 | $37,379 |
| 2016 | $413 | $45,428 | $8,782 | $36,646 |
| 2015 | $406 | $44,746 | $8,650 | $36,096 |
| 2014 | $395 | $43,870 | $8,481 | $35,389 |
Source: Public Records
Map
Nearby Homes
- 1060 W Belleview Ave
- 1087 W Belleview Ave
- 474 Douglas St
- 640 N Prospect St
- 0 W Morton Unit 234694
- 700 N Prospect St
- 816 W Grand Ave
- 360 N Capitola Ct Unit 4
- 824 W Grand Ave
- 347 Ohio Cir
- 670 W Kanai Ave
- 1343 W Morton Ave Unit Sp 84
- 643 W Belleview Ave
- 1137 W Putnam Ave
- 1147 W Putnam Ave
- 579 N Villa St
- 701 Theta Ave
- 701 W Theta Ave
- 572 Memory Ln
- 590 W Morton Ave
- 1041 W Grand Ave
- 1021 W Grand Ave
- 580 N Capitola St
- 572 N Capitola St
- 564 N Capitola St
- 591 N Capitola St
- 579 N Capitola St
- 554 N Capitola St
- 553 N Capitola St
- 1071 W Grand Ave
- 563 N Capitola St
- 1085 W Grand Ave
- 540 N Capitola St
- 1085 W Grand Ave
- 539 N Capitola St
- 566 Douglas St
- 1089 W Grand Ave
- 530 N Capitola St
- 1040 W Grand Ave
- 554 Douglas St