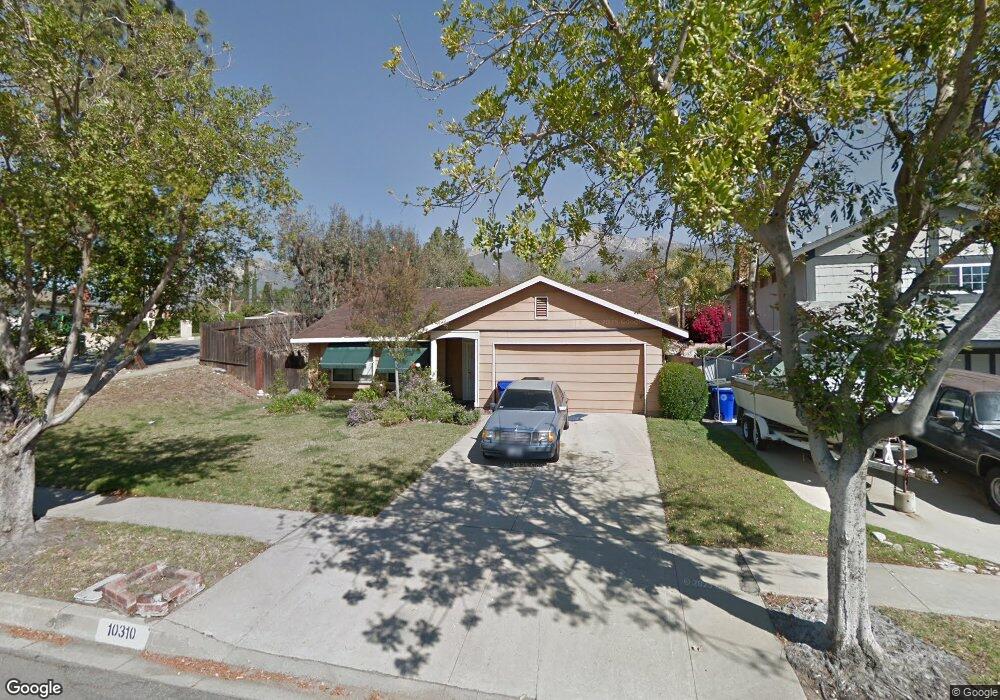
10310 Orange St Rancho Cucamonga, CA 91737
Alta Loma NeighborhoodEstimated Value: $663,780 - $793,000
3
Beds
2
Baths
1,466
Sq Ft
$502/Sq Ft
Est. Value
About This Home
This home is located at 10310 Orange St, Rancho Cucamonga, CA 91737 and is currently estimated at $736,195, approximately $502 per square foot. 10310 Orange St is a home located in San Bernardino County with nearby schools including Deer Canyon Elementary, Vineyard Junior High, and Los Osos High.
Ownership History
Date
Name
Owned For
Owner Type
Purchase Details
Closed on
Oct 21, 2020
Sold by
Andrade John Frank and Andrade Michelle Marie
Bought by
Andrade John F and Andrade Michelle M
Current Estimated Value
Purchase Details
Closed on
Dec 26, 2018
Sold by
Andrade Financial
Bought by
Andrade John Frank and Andrade Michelle Marie
Purchase Details
Closed on
May 8, 2018
Sold by
Handy Lisa M
Bought by
Andrade Financial
Home Financials for this Owner
Home Financials are based on the most recent Mortgage that was taken out on this home.
Original Mortgage
$187,500
Outstanding Balance
$161,814
Interest Rate
4.5%
Mortgage Type
Construction
Estimated Equity
$574,381
Create a Home Valuation Report for This Property
The Home Valuation Report is an in-depth analysis detailing your home's value as well as a comparison with similar homes in the area
Home Values in the Area
Average Home Value in this Area
Purchase History
| Date | Buyer | Sale Price | Title Company |
|---|---|---|---|
| Andrade John F | -- | None Available | |
| Andrade John Frank | -- | None Available | |
| Andrade Financial | $250,000 | Fidelity National Title |
Source: Public Records
Mortgage History
| Date | Status | Borrower | Loan Amount |
|---|---|---|---|
| Open | Andrade Financial | $187,500 |
Source: Public Records
Tax History
| Year | Tax Paid | Tax Assessment Tax Assessment Total Assessment is a certain percentage of the fair market value that is determined by local assessors to be the total taxable value of land and additions on the property. | Land | Improvement |
|---|---|---|---|---|
| 2025 | $4,278 | $375,482 | $113,782 | $261,700 |
| 2024 | $4,173 | $368,120 | $111,551 | $256,569 |
| 2023 | $4,081 | $360,902 | $109,364 | $251,538 |
| 2022 | $4,071 | $353,826 | $107,220 | $246,606 |
| 2021 | $4,070 | $346,889 | $105,118 | $241,771 |
| 2020 | $3,907 | $343,332 | $104,040 | $239,292 |
| 2019 | $3,950 | $336,600 | $102,000 | $234,600 |
| 2018 | $2,374 | $204,732 | $51,142 | $153,590 |
| 2017 | $2,269 | $200,717 | $50,139 | $150,578 |
| 2016 | $2,209 | $196,781 | $49,156 | $147,625 |
| 2015 | $2,195 | $193,826 | $48,418 | $145,408 |
| 2014 | $2,134 | $190,030 | $47,470 | $142,560 |
Source: Public Records
Map
Nearby Homes
- 10480 Alta Loma Dr
- 6270 Kinlock Ave
- 10655 Lemon Ave
- 10655 Lemon Ave Unit 3704
- 10655 Lemon Ave Unit 1001
- 10655 Lemon Ave Unit 4009
- 6600 Montresor Place
- 10332 Southridge Dr
- 10211 Corkwood Ct
- 6105 Sherry Ct
- 10456 Hamilton St
- 6587 Shawna Ave
- 6433 Aleatico Place
- 10302 Northridge Dr
- 9805 Liberty St
- 10154 Northridge Dr
- 6770 Berkshire Ave
- 10899 Mirador Dr
- 9979 Timbermist Ct
- 6471 Caledon Place
- 10320 Orange St
- 6310 Mayberry Ave
- 6320 Mayberry Ave
- 10316 Lemon Ave
- 10311 Orange St
- 10340 Orange St
- 6330 Mayberry Ave
- 10324 Lemon Ave
- 6286 Mayberry Ave
- 10331 Orange St
- 6275 Mayberry Ave
- 10348 Orange St
- 10334 Lemon Ave
- 6344 Mayberry Ave
- 6327 Halstead Ave
- 6355 Mayberry Ave
- 10343 Orange St
- 6319 Halstead Ave
- 6276 Mayberry Ave
- 6337 Halstead Ave
Your Personal Tour Guide
Ask me questions while you tour the home.