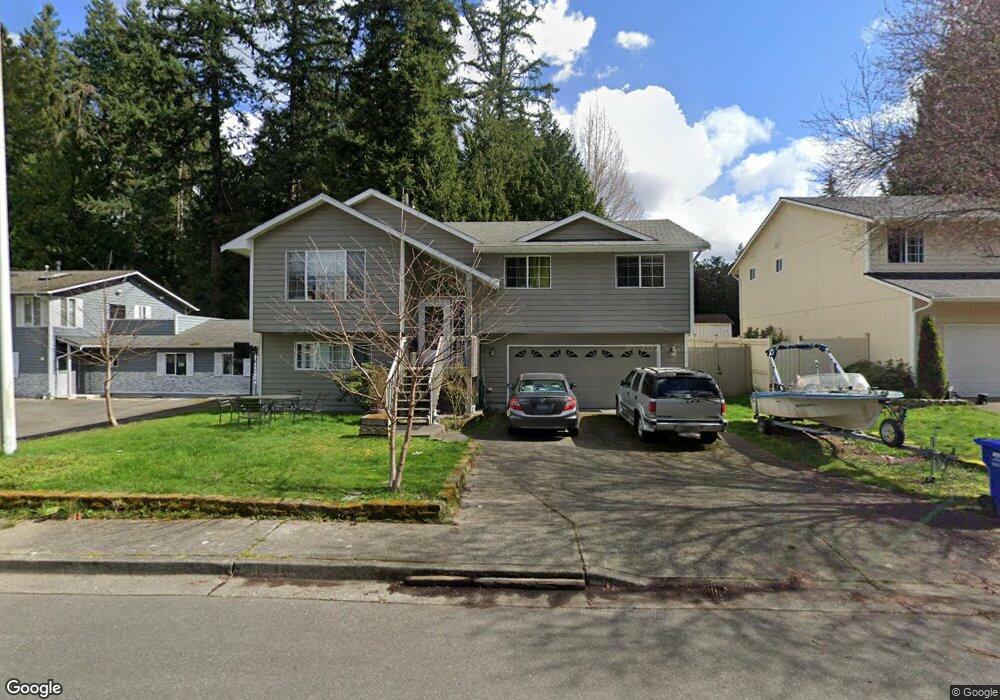
10311 8th Dr SE Everett, WA 98208
Everett Mall South NeighborhoodEstimated Value: $652,191 - $737,000
3
Beds
3
Baths
602
Sq Ft
$1,147/Sq Ft
Est. Value
About This Home
This home is located at 10311 8th Dr SE, Everett, WA 98208 and is currently estimated at $690,298, approximately $1,146 per square foot. 10311 8th Dr SE is a home located in Snohomish County with nearby schools including Jefferson Elementary School, Eisenhower Middle School, and Cascade High School.
Ownership History
Date
Name
Owned For
Owner Type
Purchase Details
Closed on
Feb 25, 2013
Sold by
Lathrop Duane M
Bought by
Lathrop Cristina S
Current Estimated Value
Home Financials for this Owner
Home Financials are based on the most recent Mortgage that was taken out on this home.
Original Mortgage
$190,000
Outstanding Balance
$130,851
Interest Rate
3.47%
Mortgage Type
New Conventional
Estimated Equity
$559,447
Purchase Details
Closed on
Apr 22, 1999
Sold by
May David A
Bought by
Lathrop Duane M and Lathrop Cristina S
Home Financials for this Owner
Home Financials are based on the most recent Mortgage that was taken out on this home.
Original Mortgage
$185,000
Interest Rate
6.98%
Mortgage Type
VA
Purchase Details
Closed on
Apr 21, 1997
Sold by
Matteson James I and Matteson Kay J
Bought by
May David A
Home Financials for this Owner
Home Financials are based on the most recent Mortgage that was taken out on this home.
Original Mortgage
$154,806
Interest Rate
7.86%
Mortgage Type
FHA
Create a Home Valuation Report for This Property
The Home Valuation Report is an in-depth analysis detailing your home's value as well as a comparison with similar homes in the area
Home Values in the Area
Average Home Value in this Area
Purchase History
| Date | Buyer | Sale Price | Title Company |
|---|---|---|---|
| Lathrop Cristina S | -- | Service Link | |
| Lathrop Duane M | $185,000 | -- | |
| May David A | $157,944 | Chicago Title Ins Co |
Source: Public Records
Mortgage History
| Date | Status | Borrower | Loan Amount |
|---|---|---|---|
| Open | Lathrop Cristina S | $190,000 | |
| Closed | Lathrop Duane M | $185,000 | |
| Previous Owner | May David A | $154,806 |
Source: Public Records
Tax History
| Year | Tax Paid | Tax Assessment Tax Assessment Total Assessment is a certain percentage of the fair market value that is determined by local assessors to be the total taxable value of land and additions on the property. | Land | Improvement |
|---|---|---|---|---|
| 2025 | $5,156 | $643,600 | $388,000 | $255,600 |
| 2024 | $5,156 | $612,600 | $357,000 | $255,600 |
| 2023 | $5,364 | $667,100 | $372,000 | $295,100 |
| 2022 | $4,483 | $500,800 | $251,000 | $249,800 |
| 2020 | $4,653 | $422,700 | $206,000 | $216,700 |
| 2019 | $4,184 | $383,200 | $174,000 | $209,200 |
| 2018 | $4,016 | $337,000 | $156,000 | $181,000 |
| 2017 | $3,672 | $307,600 | $137,000 | $170,600 |
| 2016 | $3,257 | $287,600 | $124,000 | $163,600 |
Source: Public Records
Map
Nearby Homes
- 2 xx 106th St SE
- 1206 100th Ct SE Unit 11
- 10002 13th Ave SE
- 9612 19th Ave SE Unit A
- 211 105th St SE
- 9592 7th Ave SE
- 1009 112th St SE Unit B203
- 1009 112th St SE Unit D305
- 728 95th Ct SE
- 10107 Meridian Ave
- 901 94th St SE
- 620 112th St SE Unit 154
- 620 112th St SE Unit 352
- 620 112th St SE Unit 193
- 620 112th St SE Unit 323
- 620 112th St SE Unit 205
- 620 112th St SE Unit 31
- 620 112th St SE Unit 207
- 620 112th St SE Unit 30
- 620 112th St SE Unit 23
- 10321 8th Dr SE
- 10402 9th Dr SE
- 827 103rd Place SE
- 10403 8th Dr SE
- 825 103rd Place SE
- 901 104th Place SE
- 805 103rd Place SE
- 10408 9th Dr SE
- 10409 8th Dr SE
- 10415 8th Dr SE
- 10425 8th Dr SE
- 907 104th Place SE
- 10414 9th Dr SE
- 10421 8th Dr SE
- 721 103rd Place SE
- 911 104th Place SE
- 910 104th Place SE
- 825 105th Place SE
- 817 105th Place SE
- 715 103rd Place SE
Your Personal Tour Guide
Ask me questions while you tour the home.