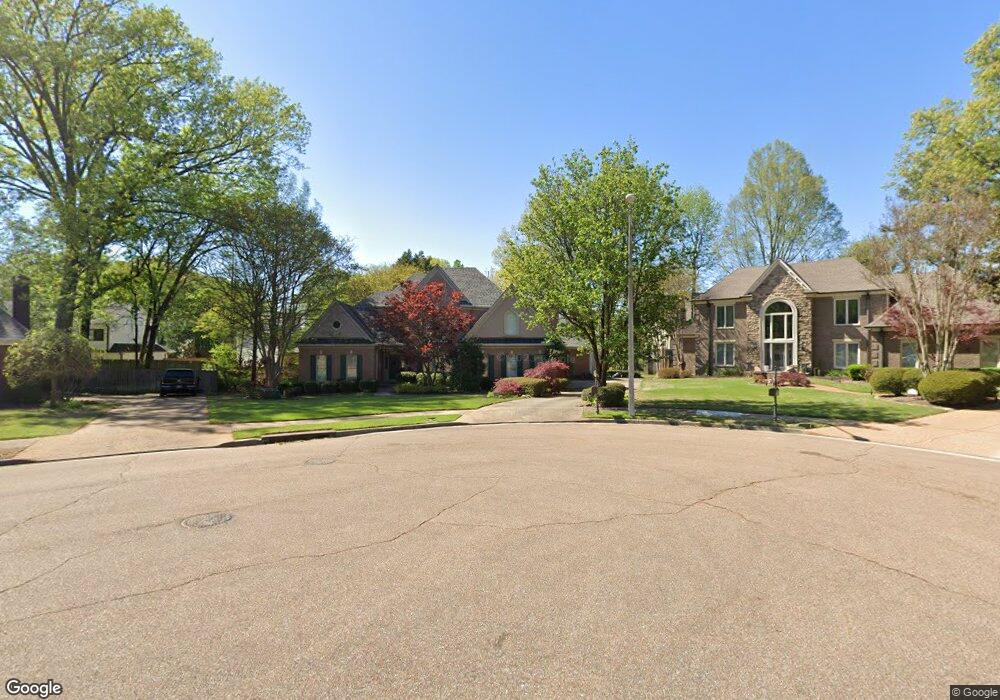
10317 Shea Oaks Cove W Collierville, TN 38017
Estimated Value: $569,120 - $625,000
3
Beds
3
Baths
3,531
Sq Ft
$170/Sq Ft
Est. Value
About This Home
This home is located at 10317 Shea Oaks Cove W, Collierville, TN 38017 and is currently estimated at $601,280, approximately $170 per square foot. 10317 Shea Oaks Cove W is a home located in Shelby County with nearby schools including Bailey Station Elementary School, West Collierville Middle School, and Collierville High School.
Ownership History
Date
Name
Owned For
Owner Type
Purchase Details
Closed on
Mar 5, 2008
Sold by
Janeski Carol V and Janeski Carolyn V
Bought by
Janeski Thomas D and Janeski Carolyn
Current Estimated Value
Purchase Details
Closed on
Dec 18, 1997
Sold by
Mark Froelich Construction Inc
Bought by
Janeski Thomas D and Janeski Carol
Home Financials for this Owner
Home Financials are based on the most recent Mortgage that was taken out on this home.
Original Mortgage
$225,000
Outstanding Balance
$38,065
Interest Rate
7.23%
Estimated Equity
$563,215
Purchase Details
Closed on
Jul 30, 1997
Sold by
Willis Charlsie W
Bought by
Mark Froelich Construction Inc
Home Financials for this Owner
Home Financials are based on the most recent Mortgage that was taken out on this home.
Original Mortgage
$238,400
Interest Rate
7.61%
Mortgage Type
Construction
Create a Home Valuation Report for This Property
The Home Valuation Report is an in-depth analysis detailing your home's value as well as a comparison with similar homes in the area
Home Values in the Area
Average Home Value in this Area
Purchase History
| Date | Buyer | Sale Price | Title Company |
|---|---|---|---|
| Janeski Thomas D | -- | None Available | |
| Janeski Carol | -- | None Available | |
| Janeski Thomas D | $325,887 | Southern Escrow Title Compan | |
| Mark Froelich Construction Inc | $69,500 | Stewart Title Company |
Source: Public Records
Mortgage History
| Date | Status | Borrower | Loan Amount |
|---|---|---|---|
| Open | Janeski Thomas D | $225,000 | |
| Previous Owner | Mark Froelich Construction Inc | $238,400 |
Source: Public Records
Tax History Compared to Growth
Tax History
| Year | Tax Paid | Tax Assessment Tax Assessment Total Assessment is a certain percentage of the fair market value that is determined by local assessors to be the total taxable value of land and additions on the property. | Land | Improvement |
|---|---|---|---|---|
| 2025 | $3,818 | $137,075 | $30,125 | $106,950 |
| 2024 | $3,818 | $112,625 | $18,000 | $94,625 |
| 2023 | $5,890 | $112,625 | $18,000 | $94,625 |
| 2022 | $5,755 | $112,625 | $18,000 | $94,625 |
| 2021 | $5,823 | $112,625 | $18,000 | $94,625 |
| 2020 | $5,590 | $95,075 | $18,000 | $77,075 |
| 2019 | $3,851 | $95,075 | $18,000 | $77,075 |
| 2018 | $3,851 | $95,075 | $18,000 | $77,075 |
| 2017 | $3,908 | $95,075 | $18,000 | $77,075 |
| 2016 | $3,718 | $85,075 | $0 | $0 |
| 2014 | $3,718 | $85,075 | $0 | $0 |
Source: Public Records
Map
Nearby Homes
- 10394 N Duncan Woods Dr
- 3406 Big Woods Cove S
- 1539 Lambs Meadow Ln
- 3385 Beaver Run Dr
- 660 Bushwillow Ln
- 3365 Stone Creek Cove
- 556 W Winding Wood Cir
- 10265 Crooked Creek Rd
- 10159 Gray Hawk Cove
- 3526 Waterford Cove N
- 3571 Waterford Cove S
- 3358 Hidden Bend Ln
- 650 Bushchat Ln
- 3485 E Taplow Way
- 881 Bray Station Rd
- 0 Dubray Manor Dr Unit 10208278
- 294 Dubray Manor Dr
- 3545 W Taplow Way
- 3310 Hidden Creek Loop
- 3544 Rokeby Farm Ln
- 10311 Shea Oaks Cove W
- 3332 Shady Forest Cove
- 10323 Shea Oaks Cove W
- 3336 Shady Forest Cove
- 3328 Shady Forest Cove
- 10405 Buckley Briar Ln
- 10310 Shea Oaks Cove W
- 10395 Buckley Briar Ln
- 10316 Shea Oaks Cove W
- 10327 Shea Oaks Cove W
- 10415 Buckley Briar Ln
- 3346 Shady Forest Cove
- 10385 Buckley Briar Ln
- 10332 Shea Oaks Cove W
- 10425 Buckley Briar Ln
- 3325 Shady Forest Cove
- 10390 Shea Woods Dr
- 10331 Shea Oaks Cove W
- 10375 Buckley Briar Ln
- 10370 Shea Woods Dr