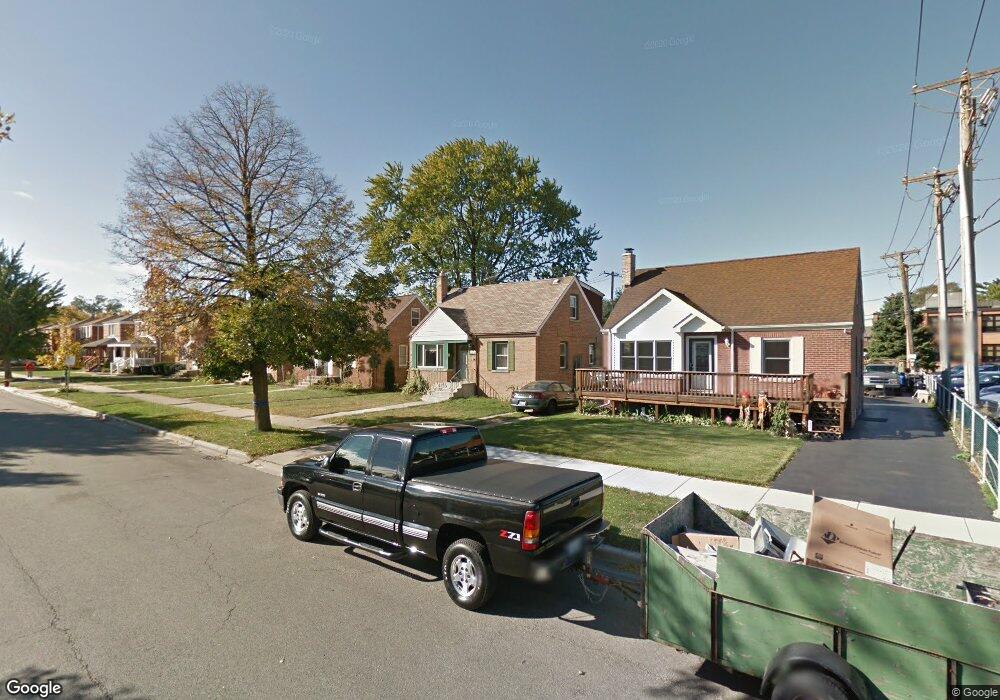
10318 S Hamlin Ave Chicago, IL 60655
Estimated Value: $329,068 - $366,000
3
Beds
2
Baths
1,270
Sq Ft
$277/Sq Ft
Est. Value
About This Home
This home is located at 10318 S Hamlin Ave, Chicago, IL 60655 and is currently estimated at $351,267, approximately $276 per square foot. 10318 S Hamlin Ave is a home located in Cook County with nearby schools including Mount Greenwood Elementary School, Morgan Park High School, and Queen Of Martyrs Elementary School.
Ownership History
Date
Name
Owned For
Owner Type
Purchase Details
Closed on
Dec 28, 2013
Sold by
Coyne Noel D
Bought by
Coyne Colleen A
Current Estimated Value
Purchase Details
Closed on
Oct 2, 2002
Sold by
Coyne Noel D and Coyne Colleen A
Bought by
Coyne Noel D and Coyne Colleen A
Home Financials for this Owner
Home Financials are based on the most recent Mortgage that was taken out on this home.
Original Mortgage
$105,000
Interest Rate
5.88%
Mortgage Type
Unknown
Purchase Details
Closed on
Dec 29, 1995
Sold by
Livin Johnsen Jane R
Bought by
Coyne Noel A and Coyne Colleen A
Home Financials for this Owner
Home Financials are based on the most recent Mortgage that was taken out on this home.
Original Mortgage
$113,400
Interest Rate
7.44%
Purchase Details
Closed on
Dec 15, 1994
Sold by
Johnsen Jane R
Bought by
Livin Johnsen Jane R and Jane R Johnsen Revocable Living Trust
Create a Home Valuation Report for This Property
The Home Valuation Report is an in-depth analysis detailing your home's value as well as a comparison with similar homes in the area
Home Values in the Area
Average Home Value in this Area
Purchase History
| Date | Buyer | Sale Price | Title Company |
|---|---|---|---|
| Coyne Colleen A | -- | None Available | |
| Coyne Noel D | -- | -- | |
| Coyne Noel D | -- | -- | |
| Coyne Noel A | $126,000 | Attorneys Natl Title Network | |
| Livin Johnsen Jane R | -- | -- |
Source: Public Records
Mortgage History
| Date | Status | Borrower | Loan Amount |
|---|---|---|---|
| Closed | Coyne Noel D | $105,000 | |
| Previous Owner | Coyne Noel A | $113,400 |
Source: Public Records
Tax History Compared to Growth
Tax History
| Year | Tax Paid | Tax Assessment Tax Assessment Total Assessment is a certain percentage of the fair market value that is determined by local assessors to be the total taxable value of land and additions on the property. | Land | Improvement |
|---|---|---|---|---|
| 2024 | $3,925 | $29,001 | $7,403 | $21,598 |
| 2023 | $4,039 | $21,873 | $5,922 | $15,951 |
| 2022 | $4,039 | $23,000 | $5,922 | $17,078 |
| 2021 | $3,967 | $23,000 | $5,922 | $17,078 |
| 2020 | $3,925 | $20,679 | $5,625 | $15,054 |
| 2019 | $3,837 | $22,478 | $5,625 | $16,853 |
| 2018 | $4,095 | $24,116 | $5,625 | $18,491 |
| 2017 | $3,632 | $20,210 | $5,033 | $15,177 |
| 2016 | $3,915 | $22,000 | $5,033 | $16,967 |
| 2015 | $4,072 | $24,790 | $5,033 | $19,757 |
| 2014 | $3,588 | $21,857 | $4,737 | $17,120 |
| 2013 | $3,505 | $21,857 | $4,737 | $17,120 |
Source: Public Records
Map
Nearby Homes
- 3723 W 104th St
- 3909 W 104th St
- 3625 W 104th St
- 10511 S Hamlin Ave
- 3534 W 103rd St
- 3955 W 104th St Unit 2B
- 10528 S Lawndale Ave
- 10418 S Pulaski Rd Unit 204C
- 10448 S Pulaski Rd
- 10314 S Komensky Ave Unit 3C
- 10606 S Ridgeway Ave
- 10206 S Saint Louis Ave
- 10126 S Pulaski Rd Unit P4
- 10110 S Pulaski Rd Unit 3W
- 10100 S Pulaski Rd Unit 1E
- 10048 S Pulaski Rd Unit 2B
- 3818 W 107th St
- 3435 W 105th Place
- 10509 Kedvale Ave
- 10041 S Saint Louis Ave
- 10322 S Hamlin Ave
- 10314 S Hamlin Ave
- 10326 S Hamlin Ave
- 10330 S Hamlin Ave
- 10327 S Avers Ave
- 10331 S Avers Ave
- 3757 W 103rd St
- 10338 S Hamlin Ave
- 10333 S Avers Ave
- 10319 S Hamlin Ave
- 10323 S Hamlin Ave
- 10315 S Hamlin Ave
- 10331 S Hamlin Ave
- 3753 W 103rd St
- 10342 S Hamlin Ave
- 10335 S Hamlin Ave
- 10337 S Hamlin Ave
- 10335 S Avers Ave
- 3749 W 103rd St
- 10346 S Hamlin Ave