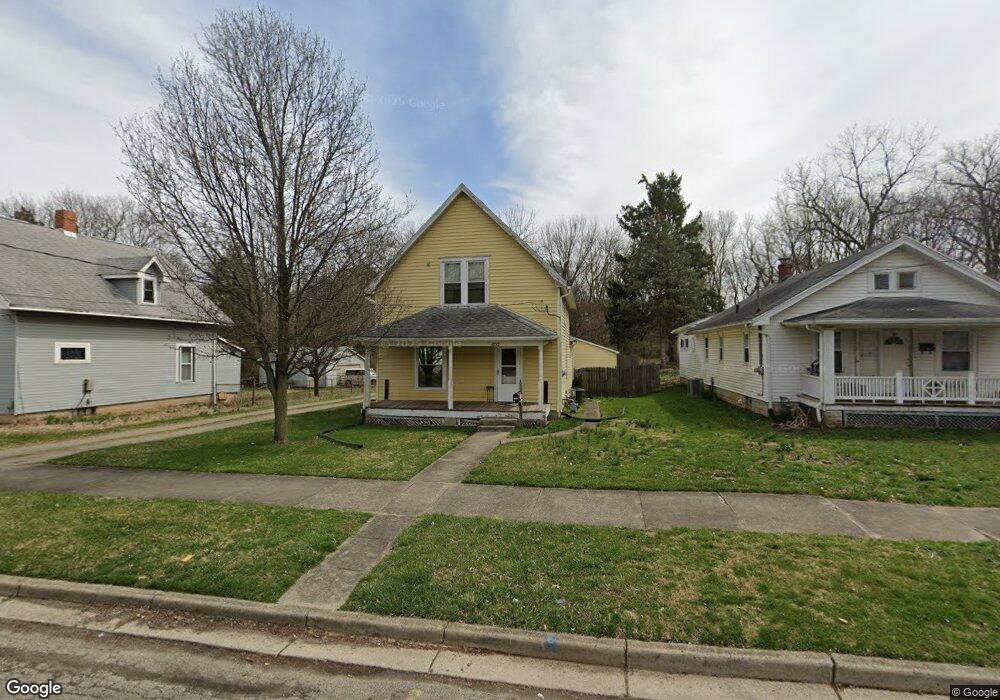
1032 Burt St Springfield, OH 45505
Estimated Value: $141,478 - $183,000
3
Beds
1
Bath
1,428
Sq Ft
$108/Sq Ft
Est. Value
About This Home
This home is located at 1032 Burt St, Springfield, OH 45505 and is currently estimated at $154,620, approximately $108 per square foot. 1032 Burt St is a home located in Clark County with nearby schools including Kenwood Elementary School, Hayward Middle School, and Springfield High School.
Ownership History
Date
Name
Owned For
Owner Type
Purchase Details
Closed on
Apr 3, 2014
Sold by
Clark Dawn L and Clark Daniel S
Bought by
Mccann Steven M and Mccann Lisa A
Current Estimated Value
Home Financials for this Owner
Home Financials are based on the most recent Mortgage that was taken out on this home.
Original Mortgage
$67,750
Outstanding Balance
$50,990
Interest Rate
4.31%
Mortgage Type
FHA
Estimated Equity
$103,630
Purchase Details
Closed on
Jul 28, 2003
Sold by
Cecily Morrow and Cecily Joseph R
Bought by
Clark Dawn L and Oman Dawn Louise
Home Financials for this Owner
Home Financials are based on the most recent Mortgage that was taken out on this home.
Original Mortgage
$42,500
Interest Rate
5.3%
Mortgage Type
Purchase Money Mortgage
Purchase Details
Closed on
Jan 17, 1997
Sold by
Morrow Joseph R
Bought by
Omen Dawn L
Purchase Details
Closed on
Apr 23, 1996
Sold by
Finney Jonathon R
Bought by
Morrow Cecily
Create a Home Valuation Report for This Property
The Home Valuation Report is an in-depth analysis detailing your home's value as well as a comparison with similar homes in the area
Home Values in the Area
Average Home Value in this Area
Purchase History
| Date | Buyer | Sale Price | Title Company |
|---|---|---|---|
| Mccann Steven M | $69,000 | Springdale Title Llc | |
| Clark Dawn L | $59,900 | -- | |
| Omen Dawn L | $59,900 | -- | |
| Morrow Cecily | $39,000 | -- |
Source: Public Records
Mortgage History
| Date | Status | Borrower | Loan Amount |
|---|---|---|---|
| Open | Mccann Steven M | $67,750 | |
| Previous Owner | Clark Dawn L | $42,500 | |
| Closed | Omen Dawn L | $0 |
Source: Public Records
Tax History
| Year | Tax Paid | Tax Assessment Tax Assessment Total Assessment is a certain percentage of the fair market value that is determined by local assessors to be the total taxable value of land and additions on the property. | Land | Improvement |
|---|---|---|---|---|
| 2025 | $1,511 | $43,710 | $6,530 | $37,180 |
| 2024 | $1,471 | $30,530 | $6,110 | $24,420 |
| 2023 | $1,471 | $30,530 | $6,110 | $24,420 |
| 2022 | $1,507 | $30,530 | $6,110 | $24,420 |
| 2021 | $1,452 | $27,130 | $3,730 | $23,400 |
| 2020 | $1,455 | $27,130 | $3,730 | $23,400 |
| 2019 | $1,459 | $27,130 | $3,730 | $23,400 |
| 2018 | $1,271 | $22,720 | $3,500 | $19,220 |
| 2017 | $1,270 | $22,911 | $3,500 | $19,411 |
| 2016 | $1,271 | $22,911 | $3,500 | $19,411 |
| 2015 | $1,305 | $20,934 | $3,500 | $17,434 |
| 2014 | $1,299 | $20,934 | $3,500 | $17,434 |
| 2013 | $1,285 | $20,934 | $3,500 | $17,434 |
Source: Public Records
Map
Nearby Homes
- 1225 Beacon St
- 1652 Kenton St
- 908 Pine St
- 1714 Kenton St
- 920 Oak St
- 1111 Lafayette Ave
- 1440 Selma Rd
- 1609 Irwin Ave
- 1554 S Belmont Ave
- 453 E Pleasant St
- 900 E Rose St
- 360 S Greenmount Ave
- 1806 N Sweetbriar Ln
- 2108 Sunset Ave
- 652 E Southern Ave
- 1724 S Belmont Ave
- 321 Glenn Ave
- 315 Glenn Ave
- 1585 Mound St
- 1569-1571 Mound St
Your Personal Tour Guide
Ask me questions while you tour the home.