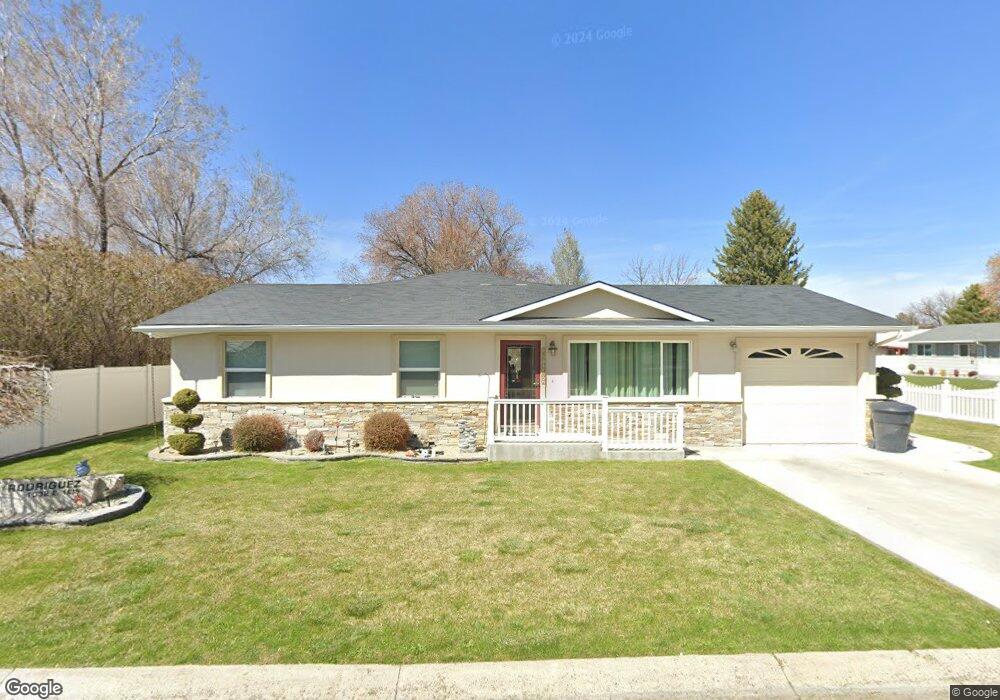
1032 E 18th Way Burley, ID 83318
Estimated Value: $243,000 - $271,000
About This Home
This home is located at 1032 E 18th Way, Burley, ID 83318 and is currently estimated at $257,039, approximately $254 per square foot. 1032 E 18th Way is a home located in Cassia County with nearby schools including White Pine Elementary School, Dworshak Elementary School, and Burley Junior High School.
Ownership History
We collect this data history from publicly available records. To have your information removed, we recommend requesting removal directly through your county’s website.
Purchase Details
Home Financials for this Owner
Home Financials are based on the most recent Mortgage that was taken out on this home.Purchase Details
Home Financials for this Owner
Home Financials are based on the most recent Mortgage that was taken out on this home.Purchase Details
Purchase History
We collect this data history from publicly available records. To have your information removed, we recommend requesting removal directly through your county’s website.
| Date | Buyer | Sale Price | Title Company |
|---|---|---|---|
| -- | Land Title And Escrow | ||
| -- | Land Title And Escrow | ||
| -- | Land Title And Escrow |
Mortgage History
We collect this data history from publicly available records. To have your information removed, we recommend requesting removal directly through your county’s website.
| Date | Status | Borrower | Loan Amount |
|---|---|---|---|
| Open | $119,352 | ||
| Closed | $68,850 | ||
| Closed | $0 |
Tax History
We collect this data history from publicly available records. To have your information removed, we recommend requesting removal directly through your county’s website.
| Year | Tax Paid | Tax Assessment Tax Assessment Total Assessment is a certain percentage of the fair market value that is determined by local assessors to be the total taxable value of land and additions on the property. | Land | Improvement |
|---|---|---|---|---|
| 2025 | $755 | $221,646 | $60,026 | $161,620 |
| 2024 | $755 | $221,212 | $59,002 | $162,210 |
| 2023 | $1,000 | $228,708 | $59,002 | $169,706 |
| 2022 | $1,056 | $191,018 | $47,200 | $143,818 |
| 2021 | $1,075 | $150,141 | $34,965 | $115,176 |
| 2020 | $850 | $105,907 | $20,034 | $85,873 |
| 2019 | $833 | $102,276 | $18,900 | $83,376 |
| 2017 | $784 | $92,438 | $15,600 | $76,838 |
| 2016 | $758 | $89,700 | $15,100 | $74,600 |
| 2015 | $747 | $88,096 | $13,496 | $74,600 |
| 2014 | $742 | $88,096 | $13,496 | $74,600 |
| 2013 | $742 | $88,754 | $13,496 | $75,258 |
Map
- 1053 E 18th St
- 500 E 19th St
- 1448 Malta Ave
- 1818 Normal Ave
- 620 Oxford St
- 2431 Dorchester Ave
- 550 Oxford St
- 2401 Bristol Ave
- 2411 Bristol Ave
- 2421 Bristol Ave
- 2431 Bristol Ave
- 2359 Almo Ave
- 1251 Almo Ave
- 320 E 23rd Dr
- 2419 Lotus Ave
- 2440 Lotus Ave
- 131 Hilltop Ct
- 1543 Oakley Ave
- TBD Bald Mountain
- 2000 Oakley Ave
- 1020 E 18th Way
- 1033 E 18th Ln
- 1021 E 18th Ln
- 1845 Bennett Ave
- 1035 E 18th Way
- 1837 Bennett Ave
- 1010 E 18th Way
- 1019 E 18th Way
- 1131 E 18th Ln
- 1851 Bennett Ave
- 1011 E 18th Ln
- 1009 E 18th Way
- 1009 E
- 1002 E 18th Way
- 1860 Bennett Ave
- 1859 Bennett Ave
- 1036 E 18th Ln
- 1026 E 18th Ln
- 1865 Bennett Ave
- 1003 E 18th Ln
Ask me questions while you tour the home.