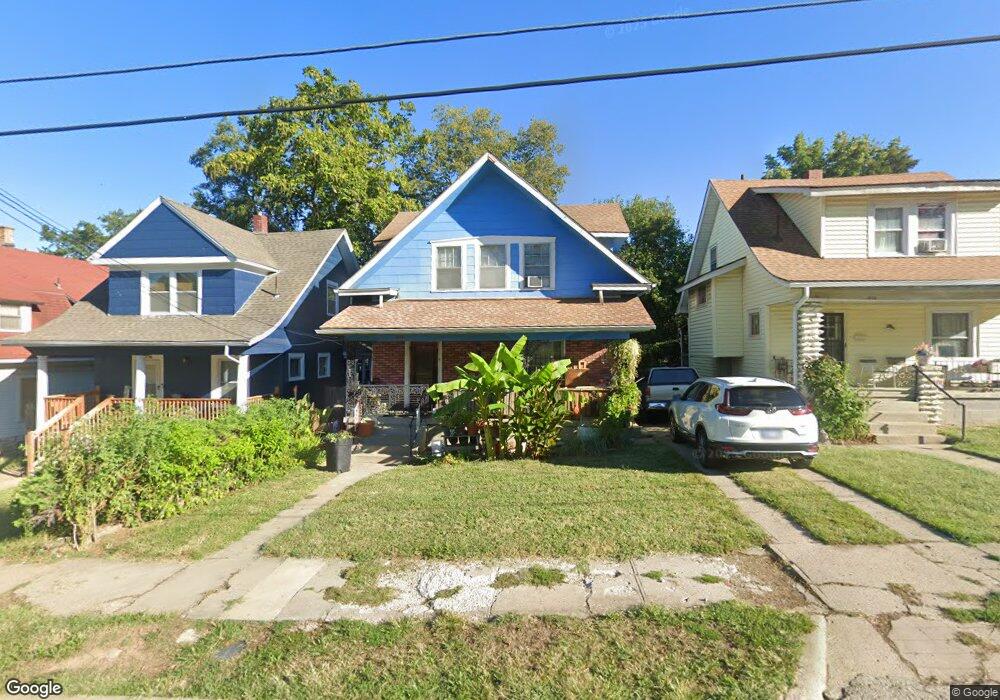
1032 Haskell Ave Kansas City, KS 66104
Northeast Kansas City NeighborhoodEstimated Value: $138,000 - $175,000
3
Beds
2
Baths
1,488
Sq Ft
$102/Sq Ft
Est. Value
About This Home
This home is located at 1032 Haskell Ave, Kansas City, KS 66104 and is currently estimated at $152,436, approximately $102 per square foot. 1032 Haskell Ave is a home located in Wyandotte County with nearby schools including Bertram Caruthers Elementary School, Carl B. Bruce Middle School, and Wyandotte High School.
Ownership History
Date
Name
Owned For
Owner Type
Purchase Details
Closed on
Sep 28, 2024
Sold by
Vang Yia
Bought by
Vue Sia
Current Estimated Value
Purchase Details
Closed on
Jan 30, 2020
Sold by
Vue Sia
Bought by
Vang Yia
Purchase Details
Closed on
Dec 18, 2009
Sold by
Vang See
Bought by
Vue Sia
Purchase Details
Closed on
Mar 27, 2008
Sold by
Bank Of New York
Bought by
Vang See
Purchase Details
Closed on
Oct 1, 2007
Sold by
Gibson Benjamin
Bought by
Bank Of New York
Purchase Details
Closed on
Dec 15, 2005
Sold by
Preston Vivian A
Bought by
Gibson Benjamin W
Home Financials for this Owner
Home Financials are based on the most recent Mortgage that was taken out on this home.
Original Mortgage
$48,000
Interest Rate
6.3%
Mortgage Type
Purchase Money Mortgage
Purchase Details
Closed on
Aug 26, 2003
Sold by
Preston Vivian A
Bought by
Saunders Alicia M
Create a Home Valuation Report for This Property
The Home Valuation Report is an in-depth analysis detailing your home's value as well as a comparison with similar homes in the area
Home Values in the Area
Average Home Value in this Area
Purchase History
| Date | Buyer | Sale Price | Title Company |
|---|---|---|---|
| Vue Sia | -- | None Listed On Document | |
| Vang Yia | -- | None Available | |
| Vue Sia | -- | First American Title | |
| Vang See | -- | First American Title | |
| Bank Of New York | $24,300 | None Available | |
| Gibson Benjamin W | -- | Guarantee Title-First Americ | |
| Saunders Alicia M | -- | -- |
Source: Public Records
Mortgage History
| Date | Status | Borrower | Loan Amount |
|---|---|---|---|
| Previous Owner | Gibson Benjamin W | $48,000 |
Source: Public Records
Tax History Compared to Growth
Tax History
| Year | Tax Paid | Tax Assessment Tax Assessment Total Assessment is a certain percentage of the fair market value that is determined by local assessors to be the total taxable value of land and additions on the property. | Land | Improvement |
|---|---|---|---|---|
| 2024 | $1,294 | $9,442 | $1,807 | $7,635 |
| 2023 | $907 | $6,106 | $1,503 | $4,603 |
| 2022 | $713 | $4,865 | $1,179 | $3,686 |
| 2021 | $541 | $3,504 | $354 | $3,150 |
| 2020 | $464 | $3,045 | $288 | $2,757 |
| 2019 | $403 | $2,680 | $288 | $2,392 |
| 2018 | $282 | $1,921 | $220 | $1,701 |
| 2017 | $286 | $1,927 | $227 | $1,700 |
| 2016 | $289 | $1,927 | $227 | $1,700 |
| 2015 | $293 | $1,927 | $227 | $1,700 |
| 2014 | $168 | $1,366 | $223 | $1,143 |
Source: Public Records
Map
Nearby Homes
- 1049 Cleveland Ave
- 1134 Haskell Ave
- 1133 Cleveland Ave
- 1009 Quindaro Blvd
- 2213 N 10th St
- 1137 Greeley Ave
- 2518 N 12th St
- 932 Greeley Ave
- 2837 Parkwood Blvd
- 1060 Kimball Ave
- 1333 Waverly Ave
- 1341 Rowland Ave
- 1336 Rowland Ave
- 823 Greeley Ave
- 1342 Georgia Ave
- 1500 Waverly Ave
- 2928 Roosevelt St
- 2609 N 8th St
- 2408 N Allis St
- 3005 N 10th St
- 1030 Haskell Ave
- 1036 Haskell Ave
- 1026 Haskell Ave
- 1040 Haskell Ave
- 1024 Haskell Ave
- 1042 Haskell Ave
- 1031 Cleveland Ave
- 1033 Cleveland Ave
- 1020 Haskell Ave
- 1039 Cleveland Ave
- 1027 Cleveland Ave
- 1044 Haskell Ave
- 1043 Cleveland Ave
- 1029 Haskell Ave
- 1018 Haskell Ave
- 1031 Haskell Ave
- 1023 Cleveland Ave
- 1035 Haskell Ave
- 1025 Haskell Ave
- 1047 Cleveland Ave