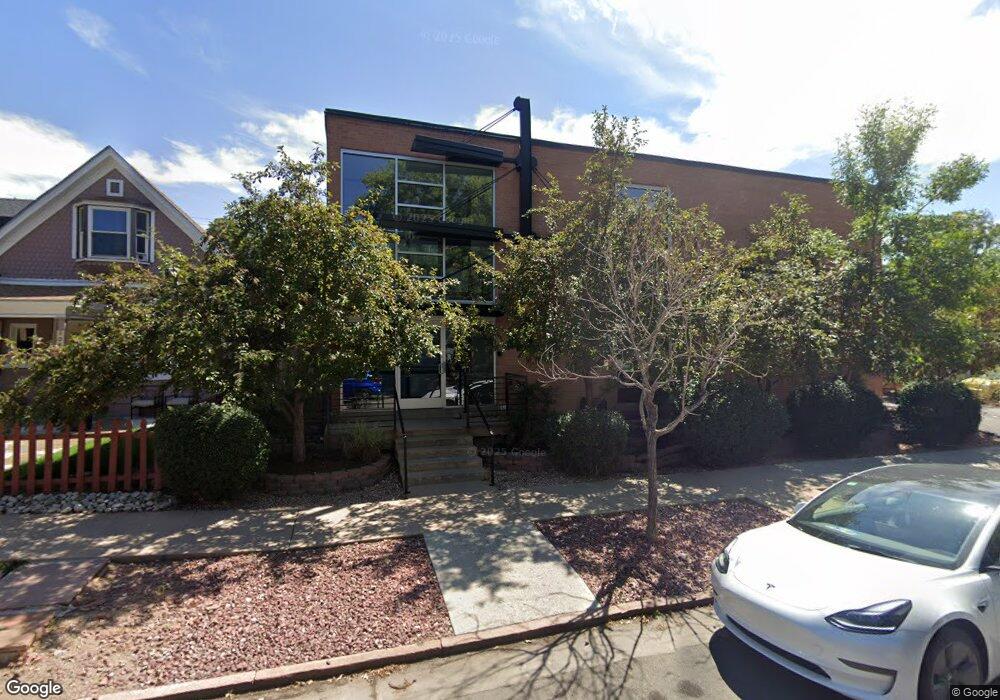
1032 N Clarkson St Unit 306 Denver, CO 80218
Capitol Hill NeighborhoodEstimated Value: $240,128 - $270,000
About This Home
Top floor condo of a three story building in the heart of Capitol Hill. This spacious and open floorplan features stylish barn doors, in-unit washer dryer, central AC and heat, granite counter-tops, hardwood (bamboo) flooring, and stainless steel kitchen appliances (including a dishwasher). One off-street parking spot, on-site storage, indoor bike rack included. Water, sewer and trash also included in rent.
This south facing condo gets a ton of natural lighting from it's large bedroom window and juliet balcony. Centrally located with great walk-ability, you will have easy access to bars, restaurants and grocery stores including King Soopers, Ideal Market, and Trader Joes. This pet-friendly condo is also a close distance to Cheeseman Park and RTD bus lines. One pet allowed with additional pet rent of $50 per month.
Ownership History
Purchase Details
Home Financials for this Owner
Home Financials are based on the most recent Mortgage that was taken out on this home.Home Values in the Area
Average Home Value in this Area
Purchase History
| Date | Buyer | Sale Price | Title Company |
|---|---|---|---|
| Oh Sunny | $133,000 | Stewart Title |
Mortgage History
| Date | Status | Borrower | Loan Amount |
|---|---|---|---|
| Open | Oh Sunny | $106,400 |
Property History
| Date | Event | Price | List to Sale | Price per Sq Ft |
|---|---|---|---|---|
| 10/25/2024 10/25/24 | Off Market | $1,650 | -- | -- |
| 10/15/2024 10/15/24 | Price Changed | $1,650 | -2.9% | $3 / Sq Ft |
| 10/06/2024 10/06/24 | For Rent | $1,700 | -- | -- |
Tax History Compared to Growth
Tax History
| Year | Tax Paid | Tax Assessment Tax Assessment Total Assessment is a certain percentage of the fair market value that is determined by local assessors to be the total taxable value of land and additions on the property. | Land | Improvement |
|---|---|---|---|---|
| 2024 | $1,289 | $16,270 | $2,100 | $14,170 |
| 2023 | $1,261 | $16,270 | $2,100 | $14,170 |
| 2022 | $1,241 | $15,610 | $2,180 | $13,430 |
| 2021 | $1,198 | $16,050 | $2,240 | $13,810 |
| 2020 | $1,229 | $16,560 | $2,100 | $14,460 |
| 2019 | $1,194 | $16,560 | $2,100 | $14,460 |
| 2018 | $1,119 | $14,470 | $1,970 | $12,500 |
| 2017 | $1,116 | $14,470 | $1,970 | $12,500 |
| 2016 | $974 | $11,950 | $2,022 | $9,928 |
| 2015 | $934 | $11,950 | $2,022 | $9,928 |
| 2014 | $883 | $10,630 | $1,345 | $9,285 |
Map
- 1045 N Clarkson St Unit 102
- 1060 N Washington St Unit 1A
- 1063 N Clarkson St Unit 12
- 1113 N Washington St
- 1013 E 10th Ave Unit 1013
- 1111 Corona St
- 1125 N Washington St Unit 206
- 1125 N Washington St Unit 501
- 1215 N Emerson St Unit A
- 1035 E 10th Ave Unit 6
- 1225 N Emerson St Unit B
- 1050 N Corona St Unit 314
- 1050 N Corona St Unit 216
- 1050 N Corona St Unit 105
- 1050 N Corona St Unit 308
- 1050 N Corona St Unit 215
- 1233 N Ogden St Unit 503
- 1233 N Ogden St Unit 312
- 931 Emerson St Unit 1
- 985 Corona St Unit 203
- 1032 Clarkson St Unit 308
- 1032 Clarkson St Unit 307
- 1032 Clarkson St Unit 306
- 1032 Clarkson St Unit 305
- 1032 Clarkson St Unit 304
- 1032 Clarkson St Unit 303
- 1032 Clarkson St Unit 302
- 1032 Clarkson St Unit 301
- 1032 Clarkson St Unit 208
- 1032 Clarkson St Unit 207
- 1032 Clarkson St Unit 206
- 1032 Clarkson St Unit 205
- 1032 Clarkson St Unit 204
- 1032 Clarkson St Unit 203
- 1032 Clarkson St Unit 202
- 1032 Clarkson St Unit 201
- 1032 Clarkson St Unit 108
- 1032 Clarkson St Unit 107
- 1032 Clarkson St Unit 106
- 1032 Clarkson St Unit 104