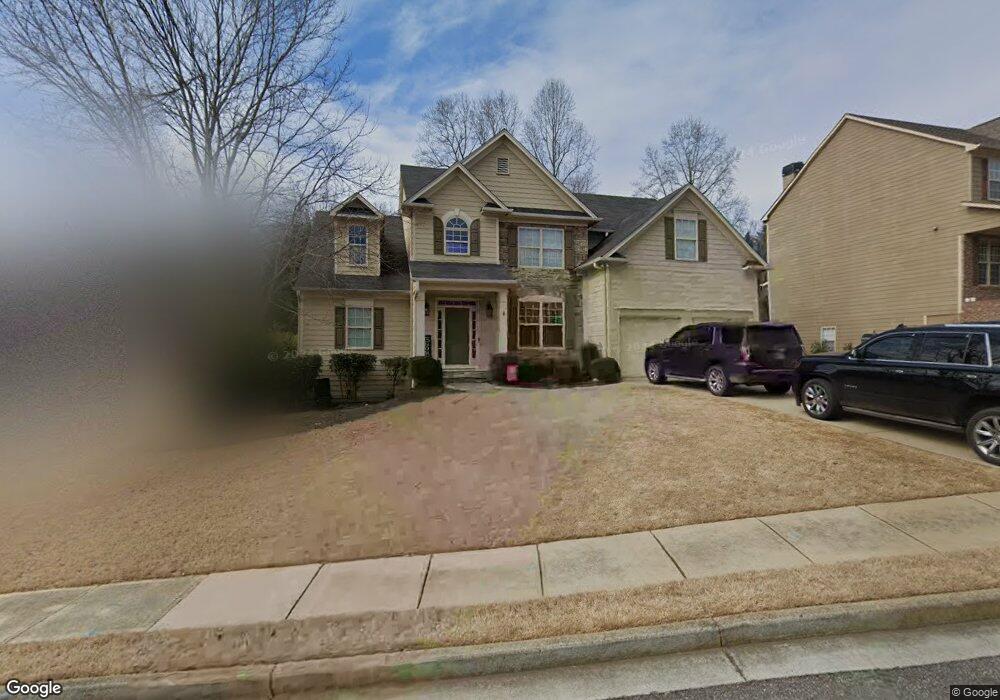
1032 Panoramic Point Buford, GA 30518
Estimated Value: $607,000 - $644,000
6
Beds
4
Baths
4,100
Sq Ft
$151/Sq Ft
Est. Value
About This Home
This home is located at 1032 Panoramic Point, Buford, GA 30518 and is currently estimated at $620,020, approximately $151 per square foot. 1032 Panoramic Point is a home located in Gwinnett County with nearby schools including White Oak Elementary School, Lanier Middle School, and Lanier High School.
Ownership History
Date
Name
Owned For
Owner Type
Purchase Details
Closed on
Jan 25, 2021
Sold by
Butler Gary C
Bought by
House Christopher
Current Estimated Value
Home Financials for this Owner
Home Financials are based on the most recent Mortgage that was taken out on this home.
Original Mortgage
$387,845
Outstanding Balance
$344,676
Interest Rate
2.6%
Mortgage Type
FHA
Estimated Equity
$275,344
Purchase Details
Closed on
Aug 7, 2015
Sold by
Miller Michelle
Bought by
Butler Gary C
Home Financials for this Owner
Home Financials are based on the most recent Mortgage that was taken out on this home.
Original Mortgage
$235,450
Interest Rate
4.09%
Mortgage Type
New Conventional
Purchase Details
Closed on
May 27, 2004
Sold by
Sharp Residential Builders & Dev
Bought by
Miller Michelle
Home Financials for this Owner
Home Financials are based on the most recent Mortgage that was taken out on this home.
Original Mortgage
$184,932
Interest Rate
5.89%
Mortgage Type
New Conventional
Create a Home Valuation Report for This Property
The Home Valuation Report is an in-depth analysis detailing your home's value as well as a comparison with similar homes in the area
Home Values in the Area
Average Home Value in this Area
Purchase History
| Date | Buyer | Sale Price | Title Company |
|---|---|---|---|
| House Christopher | $395,000 | -- | |
| Butler Gary C | $277,000 | -- | |
| Miller Michelle | $231,200 | -- |
Source: Public Records
Mortgage History
| Date | Status | Borrower | Loan Amount |
|---|---|---|---|
| Open | House Christopher | $387,845 | |
| Previous Owner | Butler Gary C | $235,450 | |
| Previous Owner | Miller Michelle | $184,932 |
Source: Public Records
Tax History Compared to Growth
Tax History
| Year | Tax Paid | Tax Assessment Tax Assessment Total Assessment is a certain percentage of the fair market value that is determined by local assessors to be the total taxable value of land and additions on the property. | Land | Improvement |
|---|---|---|---|---|
| 2025 | $7,651 | $273,360 | $50,000 | $223,360 |
| 2024 | $6,745 | $222,080 | $39,600 | $182,480 |
| 2023 | $6,745 | $222,080 | $39,600 | $182,480 |
| 2022 | $5,392 | $158,000 | $24,800 | $133,200 |
| 2021 | $4,408 | $134,640 | $24,800 | $109,840 |
| 2020 | $4,439 | $134,640 | $24,800 | $109,840 |
| 2019 | $4,048 | $122,440 | $24,800 | $97,640 |
| 2018 | $3,854 | $113,200 | $22,000 | $91,200 |
| 2016 | $3,497 | $95,840 | $19,360 | $76,480 |
| 2015 | $3,406 | $95,840 | $19,360 | $76,480 |
| 2014 | -- | $101,840 | $19,360 | $82,480 |
Source: Public Records
Map
Nearby Homes
- 1038 Island View Ct Unit 2
- 6479 Mobilis Ct
- 1000 Island Bluff Ln Unit 1
- 6385 Grand Magnolia Dr
- 6597 River Island Dr
- 6945 Melody Ridge Rd
- 1114 Blue Water Ct
- 6944 Melody Ridge Rd
- 6935 Melody Ridge Rd
- 852 van Briggle Path
- 6427 Blue Water Dr
- 6437 Blue Water Dr
- The Danbury C Plan at Melody Lakeside Estates
- The Hampton B Plan at Melody Lakeside Estates
- The Hickory B Plan at Melody Lakeside Estates
- 6858 Pierless Ave
- 6108 Pierless Ave
- 6670 Island Pointe Dr
- 6330 Weller Trail
- 932 Homepark Cir
- 1032 Panoramic Pointe
- 1032 Panoramic Point Unit 2
- 1022 Panoramic Pointe
- 1042 Panoramic Point
- 1022 Panoramic Pointe NE
- 1042 Panoramic Pointe Unit 2
- 1022 Panoramic Point
- 1013 Island View Ct
- 1012 Panoramic Pointe
- 1012 Panoramic Point Unit 2
- 1012 Panoramic Point
- 1052 Panoramic Pointe Unit 2
- 1037 Panoramic Point
- 1027 Panoramic Pointe Unit 2
- 1003 Island View Ct
- 1057 Panoramic Pointe NE
- 1057 Panoramic Pointe Unit 2
- 1007 Panoramic Pointe
- 1007 Panoramic Point
- 1017 Panoramic Pointe