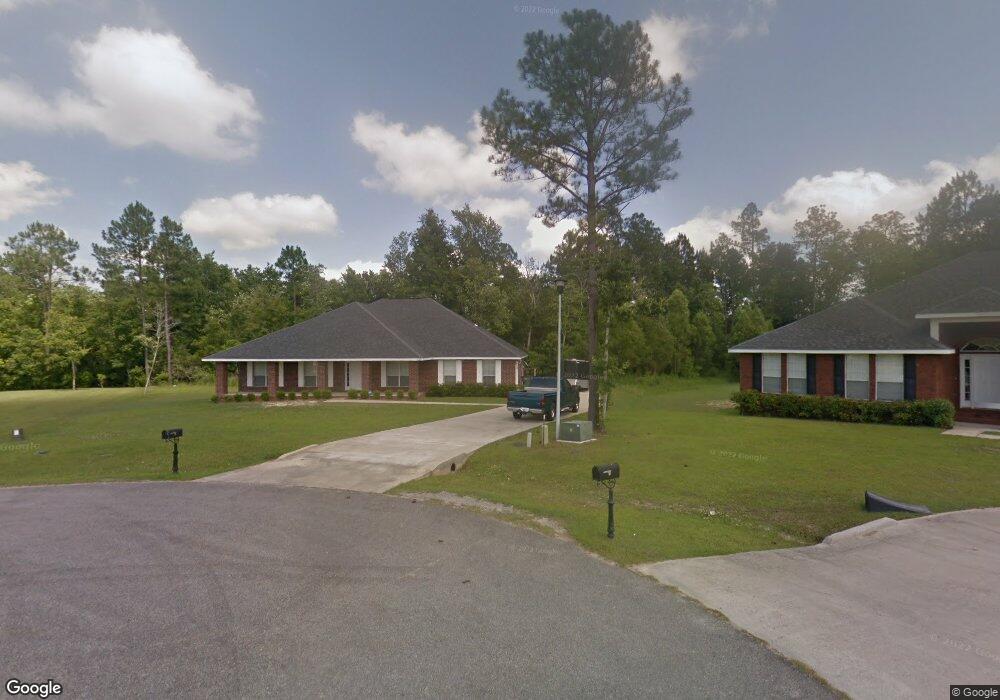
10321 Red Leaf Cir Vancleave, MS 39565
Estimated Value: $380,000 - $409,364
4
Beds
3
Baths
3,117
Sq Ft
$126/Sq Ft
Est. Value
About This Home
This home is located at 10321 Red Leaf Cir, Vancleave, MS 39565 and is currently estimated at $393,091, approximately $126 per square foot. 10321 Red Leaf Cir is a home located in Jackson County with nearby schools including St Martin East Elementary School, St Martin North Elementary School, and St Martin Upper Elementary School.
Ownership History
Date
Name
Owned For
Owner Type
Purchase Details
Closed on
Oct 24, 2011
Sold by
The Secretary Of Veterans Affaors And Of
Bought by
Terrell Freddie and Terrell Brenda
Current Estimated Value
Home Financials for this Owner
Home Financials are based on the most recent Mortgage that was taken out on this home.
Original Mortgage
$172,480
Outstanding Balance
$118,486
Interest Rate
4.25%
Mortgage Type
FHA
Estimated Equity
$274,605
Create a Home Valuation Report for This Property
The Home Valuation Report is an in-depth analysis detailing your home's value as well as a comparison with similar homes in the area
Home Values in the Area
Average Home Value in this Area
Purchase History
| Date | Buyer | Sale Price | Title Company |
|---|---|---|---|
| Terrell Freddie | -- | -- |
Source: Public Records
Mortgage History
| Date | Status | Borrower | Loan Amount |
|---|---|---|---|
| Open | Terrell Freddie | $172,480 |
Source: Public Records
Tax History Compared to Growth
Tax History
| Year | Tax Paid | Tax Assessment Tax Assessment Total Assessment is a certain percentage of the fair market value that is determined by local assessors to be the total taxable value of land and additions on the property. | Land | Improvement |
|---|---|---|---|---|
| 2024 | $1,899 | $23,708 | $3,871 | $19,837 |
| 2023 | $1,899 | $23,661 | $3,871 | $19,790 |
| 2022 | $1,845 | $23,319 | $0 | $0 |
| 2021 | $1,844 | $23,319 | $23,319 | $0 |
| 2020 | $1,911 | $23,319 | $3,991 | $19,328 |
| 2019 | $1,890 | $23,319 | $3,991 | $19,328 |
| 2018 | $1,927 | $23,319 | $3,991 | $19,328 |
| 2017 | $1,960 | $23,319 | $3,991 | $19,328 |
| 2016 | $2,474 | $23,319 | $3,991 | $19,328 |
| 2015 | $2,303 | $217,620 | $39,910 | $177,710 |
| 2014 | $3,939 | $33,529 | $5,987 | $27,542 |
| 2013 | $3,808 | $33,529 | $5,987 | $27,542 |
Source: Public Records
Map
Nearby Homes
- 0 Maple Cove
- 0 Muszar Ln
- 13601 Virginia St
- 13809 Briarwood Dr
- 13505 Sarus Dr
- The Camden Plan at Crane Landing
- The Jasmine Plan at Crane Landing
- The Destin Plan at Crane Landing
- The Hawthorne Plan at Crane Landing
- The Holly Plan at Crane Landing
- 13509 Sarus Dr
- 13517 Sarus Dr
- 13461 Crane Dr
- 13465 Crane Dr
- 13412 Crane Dr
- 13457 Crane Dr
- 13445 Crane Dr
- 13409 Crane Dr
- 13441 Crane Dr
- 13529 Sarus Dr
- 10311 Red Leaf Cir
- 10310 Red Leaf Cir
- 10283 Lake Forest Dr
- 10278 Maple Cove
- 10277 Lake Forest Dr
- 10287 Lake Forest Dr
- 10271 Lake Forest Dr
- 10291 Lake Forest Dr
- 10284 Lake Forest Dr
- 10277 Maple Cove
- 10288 Lake Forest Dr
- 10330 Black Gum Dr
- 10284 Maple Cove
- 10269 Lake Forest Dr
- 10269 Lake Forest Dr
- 10295 Lake Forest Dr
- 10276 Lake Forest Dr
- 10292 Lake Forest Dr
- 10335 Black Gum Dr
- 10281 Maple Cove