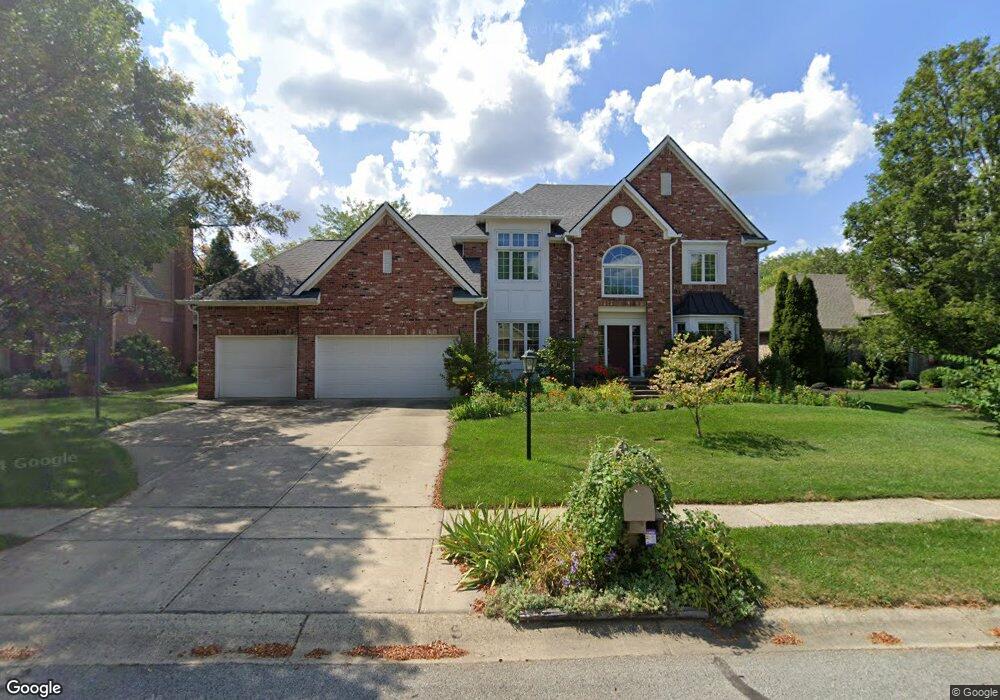
10321 Woods Edge Dr Fishers, IN 46037
Estimated Value: $495,000 - $548,000
4
Beds
3
Baths
2,801
Sq Ft
$185/Sq Ft
Est. Value
About This Home
This home is located at 10321 Woods Edge Dr, Fishers, IN 46037 and is currently estimated at $516,809, approximately $184 per square foot. 10321 Woods Edge Dr is a home located in Hamilton County with nearby schools including Sigourney Elementary School, Lantern Road Elementary School, and Riverside Junior High School.
Ownership History
Date
Name
Owned For
Owner Type
Purchase Details
Closed on
Oct 6, 2010
Sold by
Bacon James A
Bought by
Bacon James A and Scism Jamie Lynn
Current Estimated Value
Home Financials for this Owner
Home Financials are based on the most recent Mortgage that was taken out on this home.
Original Mortgage
$210,500
Outstanding Balance
$71,923
Interest Rate
4.37%
Mortgage Type
New Conventional
Estimated Equity
$444,886
Purchase Details
Closed on
Nov 8, 2002
Sold by
Bacon Karen J
Bought by
Bacon James A
Home Financials for this Owner
Home Financials are based on the most recent Mortgage that was taken out on this home.
Original Mortgage
$248,000
Interest Rate
6.22%
Mortgage Type
Stand Alone Refi Refinance Of Original Loan
Purchase Details
Closed on
Mar 26, 2001
Sold by
Paxton Barry L and Paxton Sandra A
Bought by
Bacon James A and Bacon Karen J
Home Financials for this Owner
Home Financials are based on the most recent Mortgage that was taken out on this home.
Original Mortgage
$448,000
Outstanding Balance
$166,502
Interest Rate
7.13%
Mortgage Type
Purchase Money Mortgage
Estimated Equity
$350,307
Create a Home Valuation Report for This Property
The Home Valuation Report is an in-depth analysis detailing your home's value as well as a comparison with similar homes in the area
Home Values in the Area
Average Home Value in this Area
Purchase History
| Date | Buyer | Sale Price | Title Company |
|---|---|---|---|
| Bacon James A | -- | Midwest Title Corporation | |
| Bacon James A | -- | Conestoga Title Insurance Co | |
| Bacon James A | -- | -- |
Source: Public Records
Mortgage History
| Date | Status | Borrower | Loan Amount |
|---|---|---|---|
| Open | Bacon James A | $210,500 | |
| Closed | Bacon James A | $248,000 | |
| Open | Bacon James A | $448,000 | |
| Closed | Bacon James A | $29,000 |
Source: Public Records
Tax History Compared to Growth
Tax History
| Year | Tax Paid | Tax Assessment Tax Assessment Total Assessment is a certain percentage of the fair market value that is determined by local assessors to be the total taxable value of land and additions on the property. | Land | Improvement |
|---|---|---|---|---|
| 2024 | $4,440 | $422,600 | $68,200 | $354,400 |
| 2023 | $4,440 | $389,500 | $68,200 | $321,300 |
| 2022 | $4,414 | $367,600 | $68,200 | $299,400 |
| 2021 | $3,913 | $327,300 | $68,200 | $259,100 |
| 2020 | $3,853 | $318,400 | $68,200 | $250,200 |
| 2019 | $3,839 | $317,300 | $60,400 | $256,900 |
| 2018 | $3,655 | $301,600 | $60,400 | $241,200 |
| 2017 | $3,709 | $310,900 | $60,400 | $250,500 |
| 2016 | $3,438 | $288,800 | $60,400 | $228,400 |
| 2014 | $3,052 | $281,800 | $60,400 | $221,400 |
| 2013 | $3,052 | $289,100 | $60,400 | $228,700 |
Source: Public Records
Map
Nearby Homes
- 10272 Whitetail Cir
- 10026 Parkway Dr
- 10518 Greenway Dr
- 10244 Red Tail Dr
- 10334 Hillsborough Dr
- 10515 Collingswood Rd
- 9972 Woods Edge Dr
- 10384 Glenn Abbey Ln
- 10132 Lauren Pass
- 10737 Springston Ct
- 10661 Burning Ridge Ln
- 10290 Glenn Abbey Ln
- 10844 Fairwoods Dr
- 10331 Blue Fin Dr
- 10602 Fall Rd
- 10747 Red Pine Dr
- 9627 Summerton Dr
- 10009 Northwind Cir
- 10946 Geist Woods South Dr
- 9831 Carefree Dr
- 10311 Woods Edge Dr
- 10331 Woods Edge Dr
- 10285 Willow Bend Ct
- 10351 Woods Edge Dr
- 10295 Willow Bend Ct
- 10328 Woods Edge Dr
- 10169 Misty Knoll Ct
- 10318 Woods Edge Dr
- 10338 Woods Edge Dr
- 10338 Woods Edge Dr Unit 17
- 10308 Woods Edge Dr
- 10371 Woods Edge Dr
- 10159 Misty Knoll Ct
- 10348 Woods Edge Dr
- 10275 Willow Bend Ct
- 10292 Woods Edge Dr
- 10415 Woods Edge Dr
- 10179 Misty Knoll Ct
- 10245 Woods Edge Dr
- 10212 Hawks Lake Dr