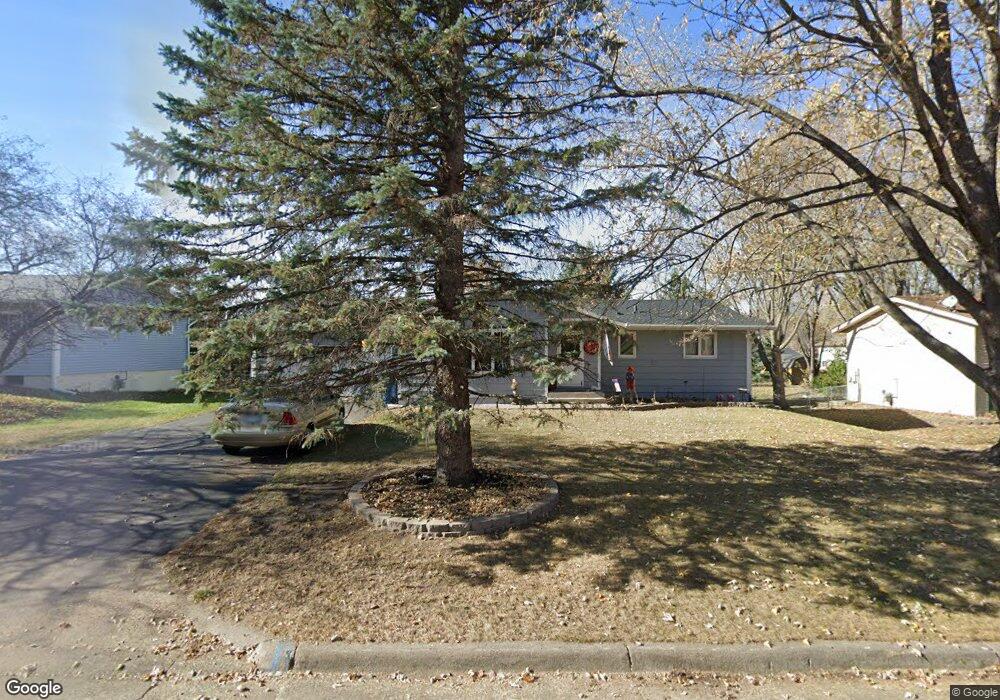
1033 10th Ave N Sauk Rapids, MN 56379
Estimated Value: $267,000 - $273,000
3
Beds
2
Baths
1,155
Sq Ft
$233/Sq Ft
Est. Value
About This Home
This home is located at 1033 10th Ave N, Sauk Rapids, MN 56379 and is currently estimated at $269,125, approximately $233 per square foot. 1033 10th Ave N is a home located in Benton County with nearby schools including Pleasant View Elementary School, Sauk Rapids-Rice Middle School, and Sauk Rapids-Rice Senior High School.
Ownership History
Date
Name
Owned For
Owner Type
Purchase Details
Closed on
Jan 19, 2022
Sold by
Irene Weber Doris
Bought by
Weber Lana Dawn
Current Estimated Value
Home Financials for this Owner
Home Financials are based on the most recent Mortgage that was taken out on this home.
Original Mortgage
$127,300
Interest Rate
3.22%
Mortgage Type
New Conventional
Purchase Details
Closed on
Nov 18, 2019
Sold by
Swanson Anne C
Bought by
Weber Doris Irene
Home Financials for this Owner
Home Financials are based on the most recent Mortgage that was taken out on this home.
Original Mortgage
$135,920
Interest Rate
3.5%
Mortgage Type
New Conventional
Purchase Details
Closed on
Dec 10, 2018
Sold by
Swanson Craig
Bought by
Swanson Anne C
Purchase Details
Closed on
Jul 28, 2017
Sold by
Revocable Trust Agreement Of Bernadette
Bought by
Swanson Kids House Llc
Create a Home Valuation Report for This Property
The Home Valuation Report is an in-depth analysis detailing your home's value as well as a comparison with similar homes in the area
Home Values in the Area
Average Home Value in this Area
Purchase History
| Date | Buyer | Sale Price | Title Company |
|---|---|---|---|
| Weber Lana Dawn | $3,333 | None Listed On Document | |
| Weber Doris Irene | $169,900 | Edina Realty Title Inc | |
| Swanson Anne C | -- | None Available | |
| Swanson Kids House Llc | -- | None Available |
Source: Public Records
Mortgage History
| Date | Status | Borrower | Loan Amount |
|---|---|---|---|
| Open | Weber Lana Dawn | $153,000 | |
| Closed | Weber Lana Dawn | $150,000 | |
| Closed | Weber Lana Dawn | $127,300 | |
| Previous Owner | Weber Doris Irene | $135,920 |
Source: Public Records
Tax History Compared to Growth
Tax History
| Year | Tax Paid | Tax Assessment Tax Assessment Total Assessment is a certain percentage of the fair market value that is determined by local assessors to be the total taxable value of land and additions on the property. | Land | Improvement |
|---|---|---|---|---|
| 2025 | $2,558 | $230,900 | $30,900 | $200,000 |
| 2024 | $2,562 | $221,600 | $30,900 | $190,700 |
| 2023 | $2,300 | $224,900 | $30,900 | $194,000 |
| 2022 | $2,290 | $189,000 | $28,100 | $160,900 |
| 2021 | $2,086 | $173,200 | $28,100 | $145,100 |
| 2020 | $2,066 | $160,700 | $27,000 | $133,700 |
| 2018 | $1,730 | $145,700 | $27,000 | $118,700 |
| 2017 | $1,730 | $103,500 | $21,646 | $81,854 |
| 2016 | $1,692 | $126,700 | $27,000 | $99,700 |
| 2015 | $1,706 | $92,900 | $21,008 | $71,892 |
| 2014 | -- | $89,900 | $20,817 | $69,083 |
| 2013 | -- | $90,200 | $20,833 | $69,367 |
Source: Public Records
Map
Nearby Homes
- 1114 Summit Way
- 302 10th Ave N
- 500 7th Ave N
- 721 6th Ave N
- 803 6th Ave N
- 804 Wildflower Ln
- 1410 Rosewood Ln
- 320 5th Ave N
- 1509 7th Ave N
- 601 4th Ave N
- 1213 4 1/2 Ave N
- 1726 Summit Ave N
- 337 9 1 2 St N
- 14 4th Ave N
- 112 Summit Ave S
- 24 3rd Ave S
- 32 3rd Ave S
- XXXX Golden Spike Rd NE
- 113 5th Ave S
- 111 9th Ave S
- 1027 10th Ave N
- 1041 10th Ave N
- 1028 9th Ave N
- 1030 10th Ave N
- 1045 10th Ave N
- 1022 9th Ave N
- 1040 10th Ave N
- 1015 10th Ave N
- 1036 9th Ave N
- 1032 9th Ave N
- 1024 10th Ave N
- 1018 9th Ave N
- 1046 10th Ave N
- 1018 10th Ave N
- 902 11th St N
- 1012 9th Ave N
- 1011 10th Ave N
- 1101 10th Ave N
- 1005 10th Ave N
- 1031 11th Ave N