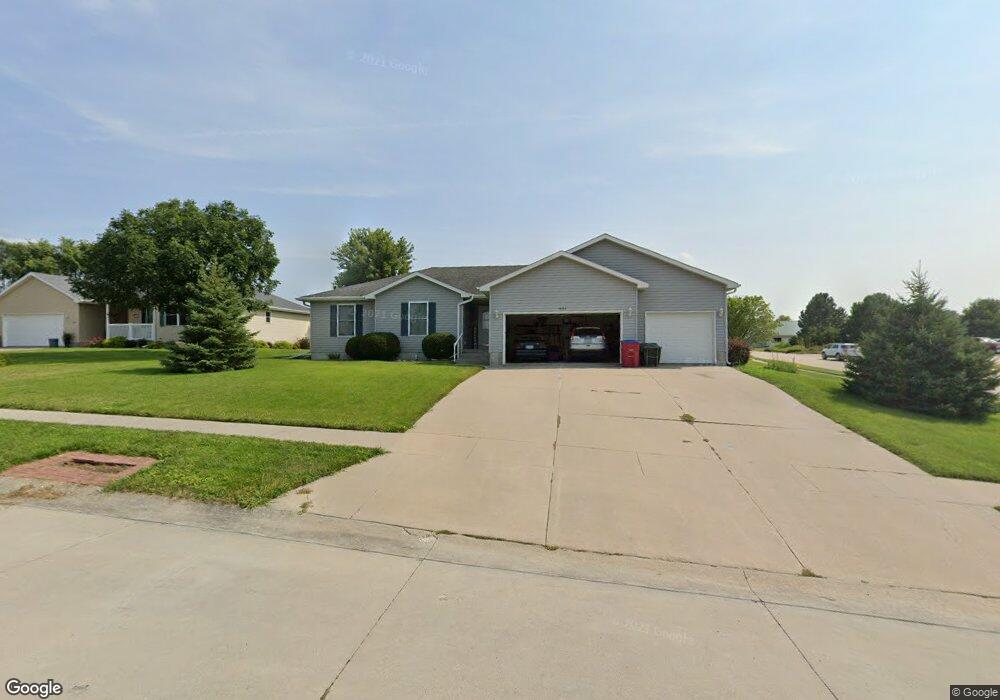
1033 12th St Syracuse, NE 68446
Estimated Value: $358,000 - $401,000
3
Beds
3
Baths
1,496
Sq Ft
$257/Sq Ft
Est. Value
About This Home
This home is located at 1033 12th St, Syracuse, NE 68446 and is currently estimated at $383,871, approximately $256 per square foot. 1033 12th St is a home located in Otoe County with nearby schools including Elementary School at Syracuse and High School at Syracuse.
Ownership History
Date
Name
Owned For
Owner Type
Purchase Details
Closed on
Jan 8, 2019
Sold by
Sisco Krista M
Bought by
Busekist Chase F and Busekist Julie A
Current Estimated Value
Home Financials for this Owner
Home Financials are based on the most recent Mortgage that was taken out on this home.
Original Mortgage
$184,000
Outstanding Balance
$161,473
Interest Rate
4.8%
Mortgage Type
New Conventional
Estimated Equity
$222,398
Purchase Details
Closed on
Aug 12, 2013
Sold by
Forbes Frank L and Forbes Myrna L
Bought by
Sisco Krista M
Home Financials for this Owner
Home Financials are based on the most recent Mortgage that was taken out on this home.
Original Mortgage
$133,200
Interest Rate
4.34%
Mortgage Type
New Conventional
Purchase Details
Closed on
Jan 28, 2009
Sold by
Forbes Frank L and Forbes Myrna L
Bought by
Forbes Frank L and Forbes Myrna L
Create a Home Valuation Report for This Property
The Home Valuation Report is an in-depth analysis detailing your home's value as well as a comparison with similar homes in the area
Purchase History
| Date | Buyer | Sale Price | Title Company |
|---|---|---|---|
| Busekist Chase F | $230,000 | Title Tracts And Escrow | |
| Sisco Krista M | $167,000 | None Available | |
| Forbes Frank L | -- | None Available |
Source: Public Records
Mortgage History
| Date | Status | Borrower | Loan Amount |
|---|---|---|---|
| Open | Busekist Chase F | $184,000 | |
| Previous Owner | Sisco Krista M | $133,200 |
Source: Public Records
Tax History
| Year | Tax Paid | Tax Assessment Tax Assessment Total Assessment is a certain percentage of the fair market value that is determined by local assessors to be the total taxable value of land and additions on the property. | Land | Improvement |
|---|---|---|---|---|
| 2025 | $3,849 | $308,674 | $23,200 | $285,474 |
| 2024 | $5,152 | $308,674 | $23,200 | $285,474 |
| 2023 | $5,152 | $266,798 | $18,560 | $248,238 |
| 2022 | $4,169 | $217,150 | $18,560 | $198,590 |
| 2021 | $4,076 | $217,150 | $18,560 | $198,590 |
| 2020 | $4,137 | $217,150 | $18,560 | $198,590 |
| 2019 | $3,070 | $159,440 | $11,000 | $148,440 |
| 2018 | $2,935 | $159,440 | $11,000 | $148,440 |
| 2017 | $2,791 | $155,620 | $7,180 | $148,440 |
| 2016 | $2,788 | $155,620 | $7,180 | $148,440 |
| 2015 | $2,809 | $155,620 | $7,180 | $148,440 |
| 2014 | $2,982 | $155,620 | $7,180 | $148,440 |
| 2012 | $3,025 | $155,620 | $7,180 | $148,440 |
Source: Public Records
Map
Nearby Homes
Your Personal Tour Guide
Ask me questions while you tour the home.