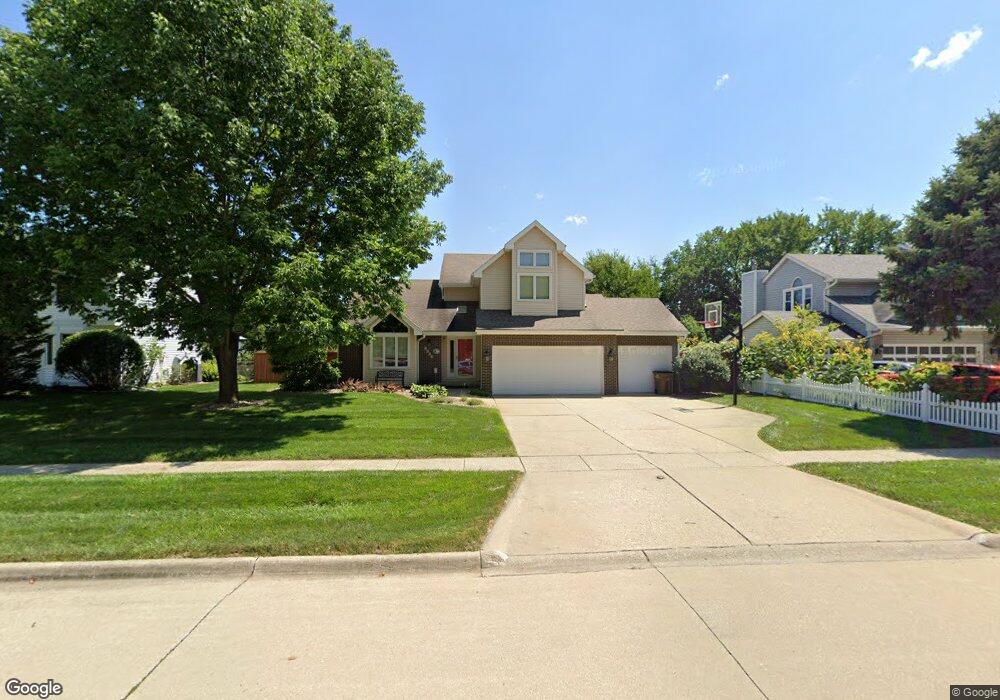
1033 59th St West Des Moines, IA 50266
Estimated Value: $366,000 - $417,248
3
Beds
3
Baths
2,124
Sq Ft
$183/Sq Ft
Est. Value
About This Home
This home is located at 1033 59th St, West Des Moines, IA 50266 and is currently estimated at $388,062, approximately $182 per square foot. 1033 59th St is a home located in Polk County with nearby schools including Westridge Elementary School, Valley Southwoods Freshman High School, and Indian Hills Junior High School.
Ownership History
Date
Name
Owned For
Owner Type
Purchase Details
Closed on
Jun 18, 1999
Sold by
Cretsinger Douglas J and Cretsinger Lisa J
Bought by
Leiberton Scott P and Leiberton Susan E
Current Estimated Value
Home Financials for this Owner
Home Financials are based on the most recent Mortgage that was taken out on this home.
Original Mortgage
$175,500
Outstanding Balance
$46,323
Interest Rate
7.06%
Estimated Equity
$341,739
Create a Home Valuation Report for This Property
The Home Valuation Report is an in-depth analysis detailing your home's value as well as a comparison with similar homes in the area
Home Values in the Area
Average Home Value in this Area
Purchase History
| Date | Buyer | Sale Price | Title Company |
|---|---|---|---|
| Leiberton Scott P | $194,500 | -- |
Source: Public Records
Mortgage History
| Date | Status | Borrower | Loan Amount |
|---|---|---|---|
| Open | Leiberton Scott P | $175,500 |
Source: Public Records
Tax History Compared to Growth
Tax History
| Year | Tax Paid | Tax Assessment Tax Assessment Total Assessment is a certain percentage of the fair market value that is determined by local assessors to be the total taxable value of land and additions on the property. | Land | Improvement |
|---|---|---|---|---|
| 2024 | $6,202 | $401,800 | $66,500 | $335,300 |
| 2023 | $6,398 | $401,800 | $66,500 | $335,300 |
| 2022 | $6,320 | $340,200 | $57,800 | $282,400 |
| 2021 | $6,116 | $340,200 | $57,800 | $282,400 |
| 2020 | $6,020 | $313,600 | $52,900 | $260,700 |
| 2019 | $5,686 | $313,600 | $52,900 | $260,700 |
| 2018 | $5,696 | $286,100 | $47,100 | $239,000 |
| 2017 | $4,856 | $286,100 | $47,100 | $239,000 |
| 2016 | $4,746 | $238,200 | $42,300 | $195,900 |
| 2015 | $4,746 | $238,200 | $42,300 | $195,900 |
| 2014 | $4,554 | $233,500 | $40,400 | $193,100 |
Source: Public Records
Map
Nearby Homes